
Advertisement
Mapletree Pan Asia Commercial Trust (SGX:N2IU) investors are sitting on a loss of 16% if they invested five years ago

In order to justify the effort of selecting individual stocks, it's worth striving to beat the returns from a market index fund. But the main game is to find enough winners to more than offset the losers At this point some shareholders may be questioning their investment in Mapletree Pan Asia Commercial Trust (SGX:N2IU), since the last five years saw the share price fall 37%.
So let's have a look and see if the longer term performance of the company has been in line with the underlying business' progress.
To quote Buffett, 'Ships will sail around the world but the Flat Earth Society will flourish. There will continue to be wide discrepancies between price and value in the marketplace...' One imperfect but simple way to consider how the market perception of a company has shifted is to compare the change in the earnings per share (EPS) with the share price movement.
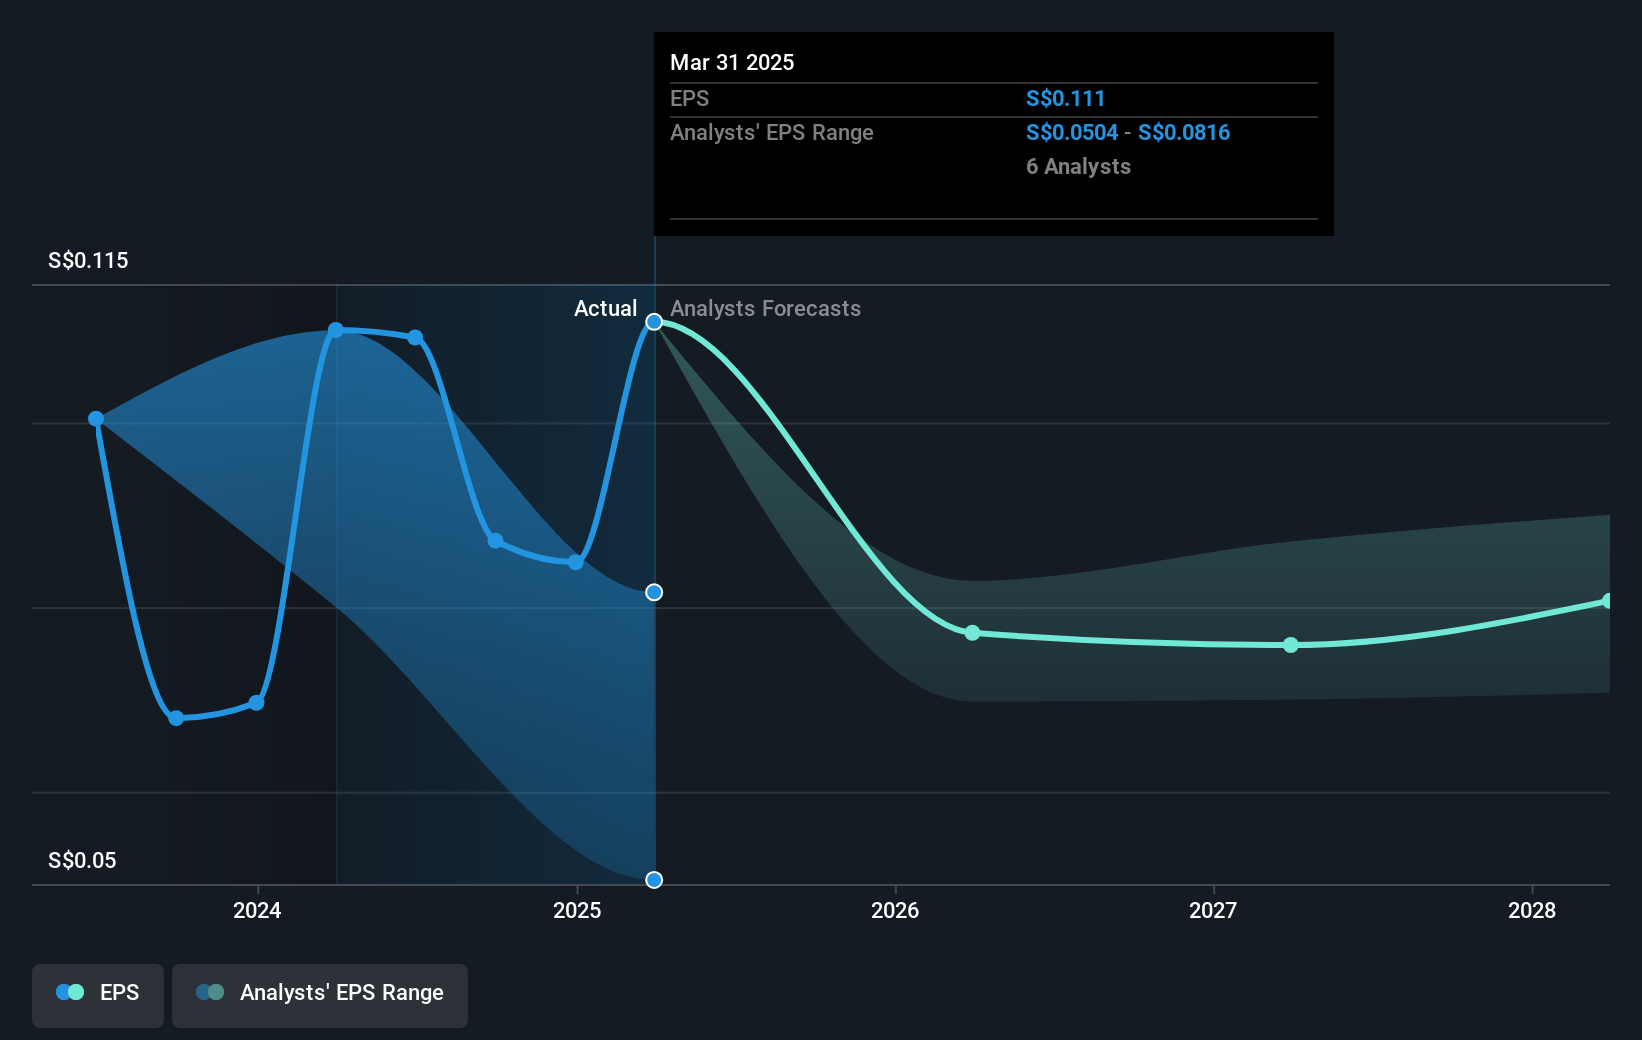
During the five years over which the share price declined, Mapletree Pan Asia Commercial Trust's earnings per share (EPS) dropped by 9.0% each year. In this case, the EPS change is really very close to the share price drop of 9% a year. This suggests that market participants have not changed their view of the company all that much. Rather, the share price has approximately tracked EPS growth.
The graphic below depicts how EPS has changed over time (unveil the exact values by clicking on the image).
We like that insiders have been buying shares in the last twelve months. Having said that, most people consider earnings and revenue growth trends to be a more meaningful guide to the business. This free interactive report on Mapletree Pan Asia Commercial Trust's earnings, revenue and cash flow is a great place to start, if you want to investigate the stock further.
What About Dividends?
When looking at investment returns, it is important to consider the difference between total shareholder return (TSR) and share price return. The TSR incorporates the value of any spin-offs or discounted capital raisings, along with any dividends, based on the assumption that the dividends are reinvested. It's fair to say that the TSR gives a more complete picture for stocks that pay a dividend. In the case of Mapletree Pan Asia Commercial Trust, it has a TSR of -16% for the last 5 years. That exceeds its share price return that we previously mentioned. The dividends paid by the company have thusly boosted the total shareholder return.
A Different Perspective
Mapletree Pan Asia Commercial Trust provided a TSR of 9.3% over the last twelve months. But that return falls short of the market. On the bright side, that's still a gain, and it is certainly better than the yearly loss of about 3% endured over half a decade. It could well be that the business is stabilizing. It's always interesting to track share price performance over the longer term. But to understand Mapletree Pan Asia Commercial Trust better, we need to consider many other factors. For instance, we've identified 4 warning signs for Mapletree Pan Asia Commercial Trust (2 shouldn't be ignored) that you should be aware of.
Mapletree Pan Asia Commercial Trust is not the only stock insiders are buying. So take a peek at this free list of small cap companies at attractive valuations which insiders have been buying.
Please note, the market returns quoted in this article reflect the market weighted average returns of stocks that currently trade on Singaporean exchanges.
New: Manage All Your Stock Portfolios in One Place
We've created the ultimate portfolio companion for stock investors, and it's free.
• Connect an unlimited number of Portfolios and see your total in one currency
• Be alerted to new Warning Signs or Risks via email or mobile
• Track the Fair Value of your stocks
Have feedback on this article? Concerned about the content? Get in touch with us directly. Alternatively, email editorial-team (at) simplywallst.com.
This article by Simply Wall St is general in nature. We provide commentary based on historical data and analyst forecasts only using an unbiased methodology and our articles are not intended to be financial advice. It does not constitute a recommendation to buy or sell any stock, and does not take account of your objectives, or your financial situation. We aim to bring you long-term focused analysis driven by fundamental data. Note that our analysis may not factor in the latest price-sensitive company announcements or qualitative material. Simply Wall St has no position in any stocks mentioned.
About SGX:N2IU
Mapletree Pan Asia Commercial Trust
Mapletree Pan Asia Commercial Trust (“MPACT”) is a real estate investment trust (“REIT”) positioned to be the proxy to key gateway markets of Asia.
Established dividend payer and good value.
Market Insights

Advertisement
Community Narratives
A case for TSXV:USA to reach USD $5.00 - $9.00 (CAD $7.30–$12.29) by 2029.
Fair Value CA$12.29|90.8% undervalued
AG
Community Contributor
DLocal's Future Growth Fueled by 35% Revenue and Profit Margin Boosts
Fair Value US$195.39|94.2% undervalued
WY
Community Contributor
Historically Cheap, but the Margin of Safety Is Still Thin
Fair Value SEK 232.58|15.9% undervalued
MA
Community Contributor