
Advertisement
- Singapore
- /
- Healthcare Services
- /
- SGX:P8A
Earnings are growing at Cordlife Group (SGX:P8A) but shareholders still don't like its prospects
Ideally, your overall portfolio should beat the market average. But in any portfolio, there will be mixed results between individual stocks. At this point some shareholders may be questioning their investment in Cordlife Group Limited (SGX:P8A), since the last five years saw the share price fall 24%. The share price has dropped 35% in three months.
If the past week is anything to go by, investor sentiment for Cordlife Group isn't positive, so let's see if there's a mismatch between fundamentals and the share price.
Check out our latest analysis for Cordlife Group
In his essay The Superinvestors of Graham-and-Doddsville Warren Buffett described how share prices do not always rationally reflect the value of a business. One imperfect but simple way to consider how the market perception of a company has shifted is to compare the change in the earnings per share (EPS) with the share price movement.
During the unfortunate half decade during which the share price slipped, Cordlife Group actually saw its earnings per share (EPS) improve by 9.5% per year. Given the share price reaction, one might suspect that EPS is not a good guide to the business performance during the period (perhaps due to a one-off loss or gain). Alternatively, growth expectations may have been unreasonable in the past.
Due to the lack of correlation between the EPS growth and the falling share price, it's worth taking a look at other metrics to try to understand the share price movement.
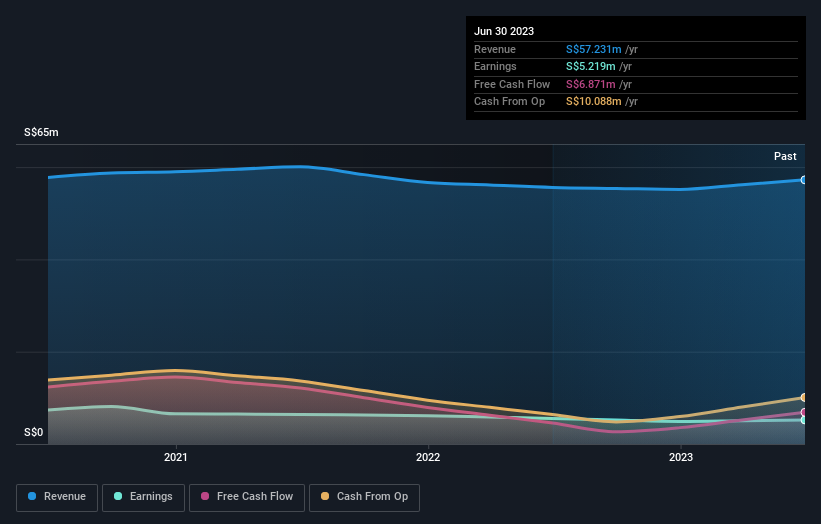
It could be that the revenue decline of 3.3% per year is viewed as evidence that Cordlife Group is shrinking. This has probably encouraged some shareholders to sell down the stock.
The company's revenue and earnings (over time) are depicted in the image below (click to see the exact numbers).
You can see how its balance sheet has strengthened (or weakened) over time in this free interactive graphic.
What About The Total Shareholder Return (TSR)?
We've already covered Cordlife Group's share price action, but we should also mention its total shareholder return (TSR). The TSR attempts to capture the value of dividends (as if they were reinvested) as well as any spin-offs or discounted capital raisings offered to shareholders. Dividends have been really beneficial for Cordlife Group shareholders, and that cash payout explains why its total shareholder loss of 18%, over the last 5 years, isn't as bad as the share price return.
A Different Perspective
We're pleased to report that Cordlife Group shareholders have received a total shareholder return of 6.9% over one year. Notably the five-year annualised TSR loss of 3% per year compares very unfavourably with the recent share price performance. We generally put more weight on the long term performance over the short term, but the recent improvement could hint at a (positive) inflection point within the business. I find it very interesting to look at share price over the long term as a proxy for business performance. But to truly gain insight, we need to consider other information, too. To that end, you should be aware of the 3 warning signs we've spotted with Cordlife Group .
If you like to buy stocks alongside management, then you might just love this free list of companies. (Hint: insiders have been buying them).
Please note, the market returns quoted in this article reflect the market weighted average returns of stocks that currently trade on Singaporean exchanges.
New: AI Stock Screener & Alerts
Our new AI Stock Screener scans the market every day to uncover opportunities.
• Dividend Powerhouses (3%+ Yield)
• Undervalued Small Caps with Insider Buying
• High growth Tech and AI Companies
Or build your own from over 50 metrics.
Have feedback on this article? Concerned about the content? Get in touch with us directly. Alternatively, email editorial-team (at) simplywallst.com.
This article by Simply Wall St is general in nature. We provide commentary based on historical data and analyst forecasts only using an unbiased methodology and our articles are not intended to be financial advice. It does not constitute a recommendation to buy or sell any stock, and does not take account of your objectives, or your financial situation. We aim to bring you long-term focused analysis driven by fundamental data. Note that our analysis may not factor in the latest price-sensitive company announcements or qualitative material. Simply Wall St has no position in any stocks mentioned.
About SGX:P8A
Cordlife Group
An investment holding company, provides cord blood banking services in Singapore, Hong Kong, India, Malaysia, the Philippines, and internationally.
Flawless balance sheet with low risk.
Market Insights

Advertisement
Community Narratives
MicroVision will explode future revenue by 380.37% with a vision towards success
Fair Value US$60.00|98.4% undervalued
TH
Community Contributor
The Indispensable Artery for a New North American Economy
Fair Value CA$132.87|1.3% undervalued
TI
Community Contributor