
Advertisement
Warren Buffett famously said, 'Volatility is far from synonymous with risk.' When we think about how risky a company is, we always like to look at its use of debt, since debt overload can lead to ruin. As with many other companies Oceanus Group Limited (SGX:579) makes use of debt. But the more important question is: how much risk is that debt creating?
When Is Debt A Problem?
Debt is a tool to help businesses grow, but if a business is incapable of paying off its lenders, then it exists at their mercy. Ultimately, if the company can't fulfill its legal obligations to repay debt, shareholders could walk away with nothing. However, a more common (but still painful) scenario is that it has to raise new equity capital at a low price, thus permanently diluting shareholders. Of course, plenty of companies use debt to fund growth, without any negative consequences. When we examine debt levels, we first consider both cash and debt levels, together.
Check out our latest analysis for Oceanus Group
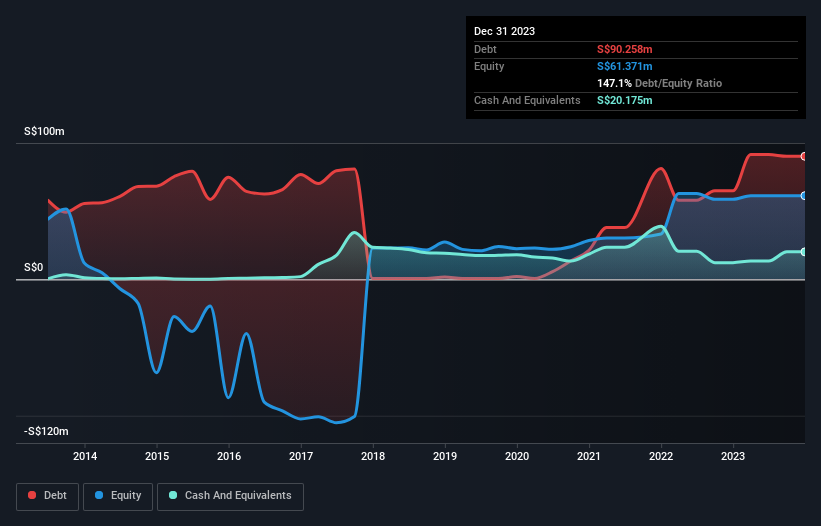
What Is Oceanus Group's Net Debt?
As you can see below, at the end of December 2023, Oceanus Group had S$90.3m of debt, up from S$65.0m a year ago. Click the image for more detail. On the flip side, it has S$20.2m in cash leading to net debt of about S$70.1m.
How Healthy Is Oceanus Group's Balance Sheet?
Zooming in on the latest balance sheet data, we can see that Oceanus Group had liabilities of S$99.2m due within 12 months and liabilities of S$24.0m due beyond that. On the other hand, it had cash of S$20.2m and S$111.5m worth of receivables due within a year. So it actually has S$8.45m more liquid assets than total liabilities.
This surplus suggests that Oceanus Group has a conservative balance sheet, and could probably eliminate its debt without much difficulty.
We use two main ratios to inform us about debt levels relative to earnings. The first is net debt divided by earnings before interest, tax, depreciation, and amortization (EBITDA), while the second is how many times its earnings before interest and tax (EBIT) covers its interest expense (or its interest cover, for short). This way, we consider both the absolute quantum of the debt, as well as the interest rates paid on it.
Oceanus Group shareholders face the double whammy of a high net debt to EBITDA ratio (7.5), and fairly weak interest coverage, since EBIT is just 1.0 times the interest expense. The debt burden here is substantial. The silver lining is that Oceanus Group grew its EBIT by 160% last year, which nourishing like the idealism of youth. If it can keep walking that path it will be in a position to shed its debt with relative ease. When analysing debt levels, the balance sheet is the obvious place to start. But you can't view debt in total isolation; since Oceanus Group will need earnings to service that debt. So when considering debt, it's definitely worth looking at the earnings trend. Click here for an interactive snapshot.
Finally, while the tax-man may adore accounting profits, lenders only accept cold hard cash. So we clearly need to look at whether that EBIT is leading to corresponding free cash flow. During the last three years, Oceanus Group burned a lot of cash. While investors are no doubt expecting a reversal of that situation in due course, it clearly does mean its use of debt is more risky.
Our View
Neither Oceanus Group's ability to convert EBIT to free cash flow nor its interest cover gave us confidence in its ability to take on more debt. But its EBIT growth rate tells a very different story, and suggests some resilience. Looking at all the angles mentioned above, it does seem to us that Oceanus Group is a somewhat risky investment as a result of its debt. Not all risk is bad, as it can boost share price returns if it pays off, but this debt risk is worth keeping in mind. The balance sheet is clearly the area to focus on when you are analysing debt. But ultimately, every company can contain risks that exist outside of the balance sheet. Be aware that Oceanus Group is showing 2 warning signs in our investment analysis , you should know about...
If you're interested in investing in businesses that can grow profits without the burden of debt, then check out this free list of growing businesses that have net cash on the balance sheet.
New: AI Stock Screener & Alerts
Our new AI Stock Screener scans the market every day to uncover opportunities.
• Dividend Powerhouses (3%+ Yield)
• Undervalued Small Caps with Insider Buying
• High growth Tech and AI Companies
Or build your own from over 50 metrics.
Have feedback on this article? Concerned about the content? Get in touch with us directly. Alternatively, email editorial-team (at) simplywallst.com.
This article by Simply Wall St is general in nature. We provide commentary based on historical data and analyst forecasts only using an unbiased methodology and our articles are not intended to be financial advice. It does not constitute a recommendation to buy or sell any stock, and does not take account of your objectives, or your financial situation. We aim to bring you long-term focused analysis driven by fundamental data. Note that our analysis may not factor in the latest price-sensitive company announcements or qualitative material. Simply Wall St has no position in any stocks mentioned.
Have feedback on this article? Concerned about the content? Get in touch with us directly. Alternatively, email editorial-team@simplywallst.com
About SGX:579
Oceanus Group
An investment holding company, sells processed marine products, sugar, beverages, and other commodities in the People’s Republic of China, Hong Kong, Macau, Singapore, and Thailand.
Slight risk with questionable track record.
Market Insights

Advertisement
Community Narratives
MicroVision will explode future revenue by 380.37% with a vision towards success
Fair Value US$60|98.4% undervalued
TH
Community Contributor
The Indispensable Artery for a New North American Economy
Fair Value CA$132.87|0.6% undervalued
TI
Community Contributor
Recently Updated Narratives
BL


BlackGoat on Alphabet ·
Alphabet: The Under-appreciated Compounder Hiding in Plain Sight
Fair Value:US$324.481.3% undervalued
75 followersusers have followed this narrative
3 commentsusers have commented on this narrative
1 likeusers have liked this narrative
BE


Bejgal on MINISO Group Holding ·
MINISO's fair value is projected at 26.69 with an anticipated PE ratio shift of 20x
Fair Value:US$26.6926.7% undervalued
44 followersusers have followed this narrative
3 commentsusers have commented on this narrative
0 likesusers have liked this narrative
TI


TickerTickle on Oracle ·
The Quiet Giant That Became AI’s Power Grid
Fair Value:US$389.8147.4% undervalued
9 followersusers have followed this narrative
2 commentsusers have commented on this narrative
0 likesusers have liked this narrative
Popular Narratives
OS

oscargarcia on Alphabet ·
The company that turned a verb into a global necessity and basically runs the modern internet, digital ads, smartphones, maps, and AI.
Fair Value:US$3405.9% undervalued
136 followersusers have followed this narrative
6 commentsusers have commented on this narrative
18 likesusers have liked this narrative
TH

TheWallstreetKing on MicroVision ·
MicroVision will explode future revenue by 380.37% with a vision towards success
Fair Value:US$6098.4% undervalued
89 followersusers have followed this narrative
11 commentsusers have commented on this narrative
18 likesusers have liked this narrative
AN


AnalystConsensusTarget on NVIDIA ·
NVDA: Expanding AI Demand Will Drive Major Data Center Investments Through 2026
Fair Value:US$232.7922.6% undervalued
926 followersusers have followed this narrative
6 commentsusers have commented on this narrative
22 likesusers have liked this narrative