
Advertisement
- Singapore
- /
- Consumer Services
- /
- SGX:CNE
Take Care Before Jumping Onto MindChamps PreSchool Limited (SGX:CNE) Even Though It's 29% Cheaper

MindChamps PreSchool Limited (SGX:CNE) shareholders that were waiting for something to happen have been dealt a blow with a 29% share price drop in the last month. Longer-term shareholders will rue the drop in the share price, since it's now virtually flat for the year after a promising few quarters.
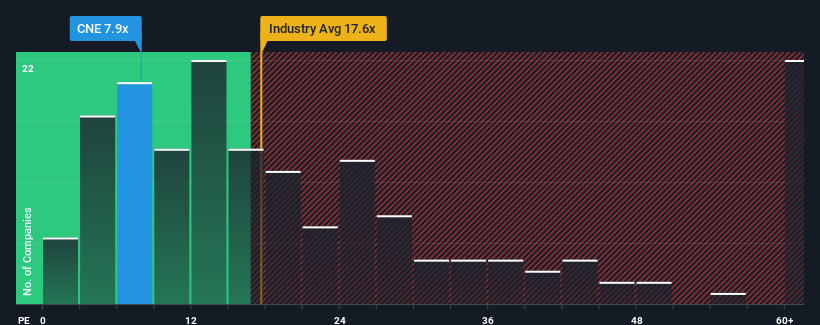
Since its price has dipped substantially, MindChamps PreSchool may be sending bullish signals at the moment with its price-to-earnings (or "P/E") ratio of 7.9x, since almost half of all companies in Singapore have P/E ratios greater than 12x and even P/E's higher than 21x are not unusual. Although, it's not wise to just take the P/E at face value as there may be an explanation why it's limited.
MindChamps PreSchool certainly has been doing a great job lately as it's been growing earnings at a really rapid pace. One possibility is that the P/E is low because investors think this strong earnings growth might actually underperform the broader market in the near future. If you like the company, you'd be hoping this isn't the case so that you could potentially pick up some stock while it's out of favour.
Check out our latest analysis for MindChamps PreSchool
How Is MindChamps PreSchool's Growth Trending?
MindChamps PreSchool's P/E ratio would be typical for a company that's only expected to deliver limited growth, and importantly, perform worse than the market.
Retrospectively, the last year delivered an exceptional 69% gain to the company's bottom line. The latest three year period has also seen an excellent 62% overall rise in EPS, aided by its short-term performance. Accordingly, shareholders would have probably welcomed those medium-term rates of earnings growth.
Weighing that recent medium-term earnings trajectory against the broader market's one-year forecast for expansion of 11% shows it's noticeably more attractive on an annualised basis.
In light of this, it's peculiar that MindChamps PreSchool's P/E sits below the majority of other companies. Apparently some shareholders believe the recent performance has exceeded its limits and have been accepting significantly lower selling prices.
The Bottom Line On MindChamps PreSchool's P/E
MindChamps PreSchool's P/E has taken a tumble along with its share price. Typically, we'd caution against reading too much into price-to-earnings ratios when settling on investment decisions, though it can reveal plenty about what other market participants think about the company.
We've established that MindChamps PreSchool currently trades on a much lower than expected P/E since its recent three-year growth is higher than the wider market forecast. When we see strong earnings with faster-than-market growth, we assume potential risks are what might be placing significant pressure on the P/E ratio. It appears many are indeed anticipating earnings instability, because the persistence of these recent medium-term conditions would normally provide a boost to the share price.
It's always necessary to consider the ever-present spectre of investment risk. We've identified 4 warning signs with MindChamps PreSchool (at least 1 which can't be ignored), and understanding them should be part of your investment process.
It's important to make sure you look for a great company, not just the first idea you come across. So take a peek at this free list of interesting companies with strong recent earnings growth (and a low P/E).
New: Manage All Your Stock Portfolios in One Place
We've created the ultimate portfolio companion for stock investors, and it's free.
• Connect an unlimited number of Portfolios and see your total in one currency
• Be alerted to new Warning Signs or Risks via email or mobile
• Track the Fair Value of your stocks
Have feedback on this article? Concerned about the content? Get in touch with us directly. Alternatively, email editorial-team (at) simplywallst.com.
This article by Simply Wall St is general in nature. We provide commentary based on historical data and analyst forecasts only using an unbiased methodology and our articles are not intended to be financial advice. It does not constitute a recommendation to buy or sell any stock, and does not take account of your objectives, or your financial situation. We aim to bring you long-term focused analysis driven by fundamental data. Note that our analysis may not factor in the latest price-sensitive company announcements or qualitative material. Simply Wall St has no position in any stocks mentioned.
About SGX:CNE
MindChamps PreSchool
Provides childcare services in Singapore and Australia.
Moderate with mediocre balance sheet.
Similar Companies
Market Insights

Advertisement
Community Narratives
Groundbreaking therapies that could change the treatment landscape for PTSD, fibromyalgia, MS & Alzheimer’s
Fair Value US$6.20|86.9% undervalued
CM
Community Contributor
DigitalOcean Will Grow 14% by Embracing AI with Paperspace Acquisition
Fair Value US$50.00|41.7% undervalued
NE
Community Contributor
Viant Technology: A Rising AdTech Challenger in the AI-Powered CTV Market
Fair Value US$38.61|63.2% undervalued
BL
Community Contributor
Volvo will Accelerate Forward into Electric and Autonomous Leadership in Five Years
Fair Value SEK 438.80|39.7% undervalued
UN
Community Contributor