
Advertisement

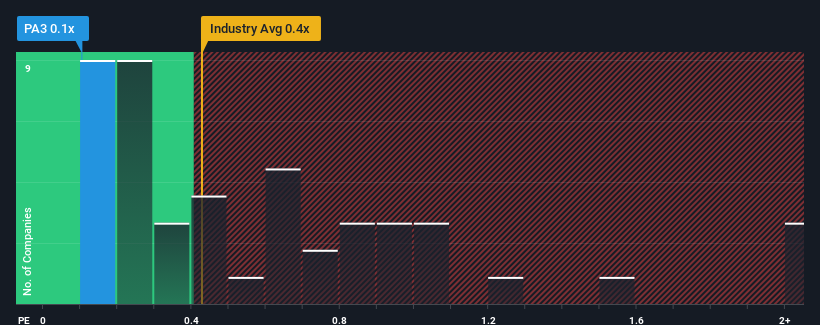
It's not a stretch to say that TA Corporation Ltd's (SGX:PA3) price-to-sales (or "P/S") ratio of 0.1x right now seems quite "middle-of-the-road" for companies in the Construction industry in Singapore, where the median P/S ratio is around 0.4x. However, investors might be overlooking a clear opportunity or potential setback if there is no rational basis for the P/S.
Check out our latest analysis for TA
What Does TA's Recent Performance Look Like?
TA certainly has been doing a great job lately as it's been growing its revenue at a really rapid pace. The P/S is probably moderate because investors think this strong revenue growth might not be enough to outperform the broader industry in the near future. Those who are bullish on TA will be hoping that this isn't the case, so that they can pick up the stock at a lower valuation.
Although there are no analyst estimates available for TA, take a look at this free data-rich visualisation to see how the company stacks up on earnings, revenue and cash flow.What Are Revenue Growth Metrics Telling Us About The P/S?
The only time you'd be comfortable seeing a P/S like TA's is when the company's growth is tracking the industry closely.
Retrospectively, the last year delivered an exceptional 68% gain to the company's top line. The strong recent performance means it was also able to grow revenue by 84% in total over the last three years. So we can start by confirming that the company has done a great job of growing revenue over that time.
Weighing that recent medium-term revenue trajectory against the broader industry's one-year forecast for expansion of 21% shows it's about the same on an annualised basis.
In light of this, it's understandable that TA's P/S sits in line with the majority of other companies. Apparently shareholders are comfortable to simply hold on assuming the company will continue keeping a low profile.
The Key Takeaway
It's argued the price-to-sales ratio is an inferior measure of value within certain industries, but it can be a powerful business sentiment indicator.
As we've seen, TA's three-year revenue trends seem to be contributing to its P/S, given they look similar to current industry expectations. Currently, with a past revenue trend that aligns closely wit the industry outlook, shareholders are confident the company's future revenue outlook won't contain any major surprises. Unless the recent medium-term conditions change, they will continue to support the share price at these levels.
Having said that, be aware TA is showing 4 warning signs in our investment analysis, and 2 of those can't be ignored.
Of course, profitable companies with a history of great earnings growth are generally safer bets. So you may wish to see this free collection of other companies that have reasonable P/E ratios and have grown earnings strongly.
Valuation is complex, but we're here to simplify it.
Discover if TA might be undervalued or overvalued with our detailed analysis, featuring fair value estimates, potential risks, dividends, insider trades, and its financial condition.
Access Free AnalysisHave feedback on this article? Concerned about the content? Get in touch with us directly. Alternatively, email editorial-team (at) simplywallst.com.
This article by Simply Wall St is general in nature. We provide commentary based on historical data and analyst forecasts only using an unbiased methodology and our articles are not intended to be financial advice. It does not constitute a recommendation to buy or sell any stock, and does not take account of your objectives, or your financial situation. We aim to bring you long-term focused analysis driven by fundamental data. Note that our analysis may not factor in the latest price-sensitive company announcements or qualitative material. Simply Wall St has no position in any stocks mentioned.
About SGX:PA3
TA
TA Corporation Ltd, an investment holding company, operates in the property and construction business primarily in Singapore, Thailand, Cambodia, Malaysia, China, and Myanmar.
Good value with mediocre balance sheet.
Market Insights

Advertisement
Community Narratives
Groundbreaking therapies that could change the treatment landscape for PTSD, fibromyalgia, MS & Alzheimer’s
Fair Value US$6.20|86.9% undervalued
CM
Community Contributor
DigitalOcean Will Grow 14% by Embracing AI with Paperspace Acquisition
Fair Value US$50.00|42.8% undervalued
NE
Community Contributor
Viant Technology: A Rising AdTech Challenger in the AI-Powered CTV Market
Fair Value US$38.61|66.0% undervalued
BL
Community Contributor
Volvo will Accelerate Forward into Electric and Autonomous Leadership in Five Years
Fair Value SEK 438.80|40.8% undervalued
UN
Community Contributor