
Advertisement
- Singapore
- /
- Construction
- /
- SGX:MF6
Subdued Growth No Barrier To Mun Siong Engineering Limited (SGX:MF6) With Shares Advancing 32%

Mun Siong Engineering Limited (SGX:MF6) shareholders would be excited to see that the share price has had a great month, posting a 32% gain and recovering from prior weakness. But the gains over the last month weren't enough to make shareholders whole, as the share price is still down 8.3% in the last twelve months.
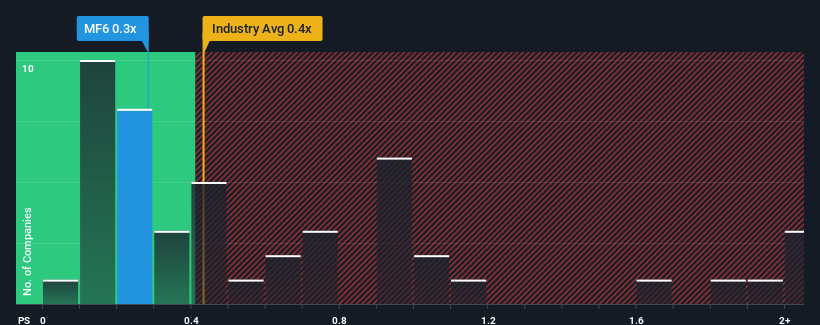
In spite of the firm bounce in price, there still wouldn't be many who think Mun Siong Engineering's price-to-sales (or "P/S") ratio of 0.3x is worth a mention when the median P/S in Singapore's Construction industry is similar at about 0.4x. Although, it's not wise to simply ignore the P/S without explanation as investors may be disregarding a distinct opportunity or a costly mistake.
See our latest analysis for Mun Siong Engineering
How Mun Siong Engineering Has Been Performing
Mun Siong Engineering has been doing a decent job lately as it's been growing revenue at a reasonable pace. Perhaps the expectation moving forward is that the revenue growth will track in line with the wider industry for the near term, which has kept the P/S subdued. If you like the company, you'd be hoping this isn't the case so that you could potentially pick up some stock while it's not quite in favour.
We don't have analyst forecasts, but you can see how recent trends are setting up the company for the future by checking out our free report on Mun Siong Engineering's earnings, revenue and cash flow.Do Revenue Forecasts Match The P/S Ratio?
In order to justify its P/S ratio, Mun Siong Engineering would need to produce growth that's similar to the industry.
Taking a look back first, we see that the company managed to grow revenues by a handy 2.5% last year. The latest three year period has also seen a 23% overall rise in revenue, aided somewhat by its short-term performance. Therefore, it's fair to say the revenue growth recently has been respectable for the company.
This is in contrast to the rest of the industry, which is expected to grow by 11% over the next year, materially higher than the company's recent medium-term annualised growth rates.
In light of this, it's curious that Mun Siong Engineering's P/S sits in line with the majority of other companies. Apparently many investors in the company are less bearish than recent times would indicate and aren't willing to let go of their stock right now. They may be setting themselves up for future disappointment if the P/S falls to levels more in line with recent growth rates.
What We Can Learn From Mun Siong Engineering's P/S?
Its shares have lifted substantially and now Mun Siong Engineering's P/S is back within range of the industry median. Generally, our preference is to limit the use of the price-to-sales ratio to establishing what the market thinks about the overall health of a company.
We've established that Mun Siong Engineering's average P/S is a bit surprising since its recent three-year growth is lower than the wider industry forecast. Right now we are uncomfortable with the P/S as this revenue performance isn't likely to support a more positive sentiment for long. If recent medium-term revenue trends continue, the probability of a share price decline will become quite substantial, placing shareholders at risk.
Don't forget that there may be other risks. For instance, we've identified 3 warning signs for Mun Siong Engineering (2 are a bit concerning) you should be aware of.
If companies with solid past earnings growth is up your alley, you may wish to see this free collection of other companies with strong earnings growth and low P/E ratios.
New: Manage All Your Stock Portfolios in One Place
We've created the ultimate portfolio companion for stock investors, and it's free.
• Connect an unlimited number of Portfolios and see your total in one currency
• Be alerted to new Warning Signs or Risks via email or mobile
• Track the Fair Value of your stocks
Have feedback on this article? Concerned about the content? Get in touch with us directly. Alternatively, email editorial-team (at) simplywallst.com.
This article by Simply Wall St is general in nature. We provide commentary based on historical data and analyst forecasts only using an unbiased methodology and our articles are not intended to be financial advice. It does not constitute a recommendation to buy or sell any stock, and does not take account of your objectives, or your financial situation. We aim to bring you long-term focused analysis driven by fundamental data. Note that our analysis may not factor in the latest price-sensitive company announcements or qualitative material. Simply Wall St has no position in any stocks mentioned.
About SGX:MF6
Mun Siong Engineering
Provides mechanical and electrical engineering services for the oil and gas, process, petrochemical, energy, chemical, power, and pharmaceutical industries worldwide.
Mediocre balance sheet low.
Market Insights

Advertisement
Community Narratives
Groundbreaking therapies that could change the treatment landscape for PTSD, fibromyalgia, MS & Alzheimer’s
Fair Value US$6.20|86.9% undervalued
CM
Community Contributor
DigitalOcean Will Grow 14% by Embracing AI with Paperspace Acquisition
Fair Value US$50.00|42.8% undervalued
NE
Community Contributor
Viant Technology: A Rising AdTech Challenger in the AI-Powered CTV Market
Fair Value US$38.61|66.0% undervalued
BL
Community Contributor
Volvo will Accelerate Forward into Electric and Autonomous Leadership in Five Years
Fair Value SEK 438.80|40.1% undervalued
UN
Community Contributor