
Advertisement
- Singapore
- /
- Construction
- /
- SGX:BRD
Returns On Capital Signal Difficult Times Ahead For Sapphire (SGX:BRD)
When we're researching a company, it's sometimes hard to find the warning signs, but there are some financial metrics that can help spot trouble early. A business that's potentially in decline often shows two trends, a return on capital employed (ROCE) that's declining, and a base of capital employed that's also declining. Ultimately this means that the company is earning less per dollar invested and on top of that, it's shrinking its base of capital employed. So after we looked into Sapphire (SGX:BRD), the trends above didn't look too great.
Return On Capital Employed (ROCE): What Is It?
If you haven't worked with ROCE before, it measures the 'return' (pre-tax profit) a company generates from capital employed in its business. The formula for this calculation on Sapphire is:
Return on Capital Employed = Earnings Before Interest and Tax (EBIT) ÷ (Total Assets - Current Liabilities)
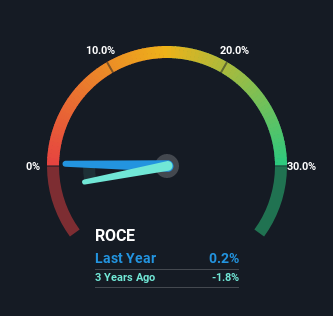
0.0021 = CN¥1.4m ÷ (CN¥742m - CN¥55m) (Based on the trailing twelve months to December 2022).
So, Sapphire has an ROCE of 0.2%. In absolute terms, that's a low return and it also under-performs the Construction industry average of 4.8%.
See our latest analysis for Sapphire
While the past is not representative of the future, it can be helpful to know how a company has performed historically, which is why we have this chart above. If you want to delve into the historical earnings, revenue and cash flow of Sapphire, check out these free graphs here.
How Are Returns Trending?
In terms of Sapphire's historical ROCE movements, the trend doesn't inspire confidence. Unfortunately the returns on capital have diminished from the 13% that they were earning five years ago. On top of that, it's worth noting that the amount of capital employed within the business has remained relatively steady. This combination can be indicative of a mature business that still has areas to deploy capital, but the returns received aren't as high due potentially to new competition or smaller margins. If these trends continue, we wouldn't expect Sapphire to turn into a multi-bagger.
On a side note, Sapphire has done well to pay down its current liabilities to 7.4% of total assets. Considering it used to be 68%, that's a huge drop in that ratio and it would explain the decline in ROCE. Effectively this means their suppliers or short-term creditors are funding less of the business, which reduces some elements of risk. Some would claim this reduces the business' efficiency at generating ROCE since it is now funding more of the operations with its own money.
The Bottom Line
In the end, the trend of lower returns on the same amount of capital isn't typically an indication that we're looking at a growth stock. It should come as no surprise then that the stock has fallen 47% over the last five years, so it looks like investors are recognizing these changes. With underlying trends that aren't great in these areas, we'd consider looking elsewhere.
One final note, you should learn about the 3 warning signs we've spotted with Sapphire (including 2 which are a bit unpleasant) .
While Sapphire may not currently earn the highest returns, we've compiled a list of companies that currently earn more than 25% return on equity. Check out this free list here.
New: Manage All Your Stock Portfolios in One Place
We've created the ultimate portfolio companion for stock investors, and it's free.
• Connect an unlimited number of Portfolios and see your total in one currency
• Be alerted to new Warning Signs or Risks via email or mobile
• Track the Fair Value of your stocks
Have feedback on this article? Concerned about the content? Get in touch with us directly. Alternatively, email editorial-team (at) simplywallst.com.
This article by Simply Wall St is general in nature. We provide commentary based on historical data and analyst forecasts only using an unbiased methodology and our articles are not intended to be financial advice. It does not constitute a recommendation to buy or sell any stock, and does not take account of your objectives, or your financial situation. We aim to bring you long-term focused analysis driven by fundamental data. Note that our analysis may not factor in the latest price-sensitive company announcements or qualitative material. Simply Wall St has no position in any stocks mentioned.
About SGX:BRD
Sapphire
An investment management and holding company, engages in engineering, procurement, and construction business related to the land transport infrastructure and water conservancy and environmental projects in Singapore and China.
Adequate balance sheet with low risk.
Market Insights

Advertisement
Community Narratives
100% Patient Improvement in trial puts this $16M Biotech on the radar
Fair Value US$5.30|69.8% undervalued
JO
Community Contributor
Exxon Mobil's 17.5% Upside Promises Industry-Leading Returns in Energy Transition
Fair Value US$132.00|15.0% undervalued
HE
Community Contributor
NHC Analysis: Quality at a Good Price. A Golden Opportunity?
Fair Value US$179.80|36.1% undervalued
DA
Community Contributor
Product Refresh And Global Expansion Will Empower Future Market Leadership
Fair Value US$202.60|21.1% undervalued
AN
Based on Analyst Price Targets