- Sweden
- /
- Communications
- /
- OM:GAPW B
Gapwaves (STO:GAPW B) pulls back 13% this week, but still delivers shareholders strong 25% CAGR over 5 years

While Gapwaves AB (publ) (STO:GAPW B) shareholders are probably generally happy, the stock hasn't had particularly good run recently, with the share price falling 30% in the last quarter. But in stark contrast, the returns over the last half decade have impressed. In fact, the share price is 195% higher today. Generally speaking the long term returns will give you a better idea of business quality than short periods can. Of course, that doesn't necessarily mean it's cheap now. Unfortunately not all shareholders will have held it for the long term, so spare a thought for those caught in the 51% decline over the last twelve months.
While the stock has fallen 13% this week, it's worth focusing on the longer term and seeing if the stocks historical returns have been driven by the underlying fundamentals.
View our latest analysis for Gapwaves
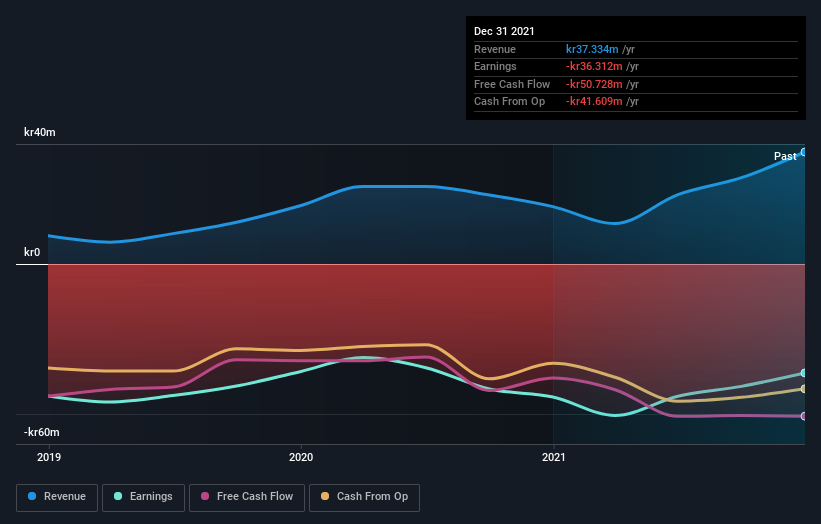
Because Gapwaves made a loss in the last twelve months, we think the market is probably more focussed on revenue and revenue growth, at least for now. Generally speaking, companies without profits are expected to grow revenue every year, and at a good clip. That's because fast revenue growth can be easily extrapolated to forecast profits, often of considerable size.
For the last half decade, Gapwaves can boast revenue growth at a rate of 31% per year. That's well above most pre-profit companies. So it's not entirely surprising that the share price reflected this performance by increasing at a rate of 24% per year, in that time. This suggests the market has well and truly recognized the progress the business has made. To our minds that makes Gapwaves worth investigating - it may have its best days ahead.
You can see below how earnings and revenue have changed over time (discover the exact values by clicking on the image).
If you are thinking of buying or selling Gapwaves stock, you should check out this FREE detailed report on its balance sheet.
What about the Total Shareholder Return (TSR)?
Investors should note that there's a difference between Gapwaves' total shareholder return (TSR) and its share price change, which we've covered above. The TSR attempts to capture the value of dividends (as if they were reinvested) as well as any spin-offs or discounted capital raisings offered to shareholders. We note that Gapwaves' TSR, at 204% is higher than its share price return of 195%. When you consider it hasn't been paying a dividend, this data suggests shareholders have benefitted from a spin-off, or had the opportunity to acquire attractively priced shares in a discounted capital raising.
A Different Perspective
We regret to report that Gapwaves shareholders are down 51% for the year. Unfortunately, that's worse than the broader market decline of 6.5%. However, it could simply be that the share price has been impacted by broader market jitters. It might be worth keeping an eye on the fundamentals, in case there's a good opportunity. Longer term investors wouldn't be so upset, since they would have made 25%, each year, over five years. It could be that the recent sell-off is an opportunity, so it may be worth checking the fundamental data for signs of a long term growth trend. I find it very interesting to look at share price over the long term as a proxy for business performance. But to truly gain insight, we need to consider other information, too. Take risks, for example - Gapwaves has 6 warning signs (and 1 which is a bit concerning) we think you should know about.
If you are like me, then you will not want to miss this free list of growing companies that insiders are buying.
Please note, the market returns quoted in this article reflect the market weighted average returns of stocks that currently trade on SE exchanges.
The New Payments ETF Is Live on NASDAQ:
Money is moving to real-time rails, and a newly listed ETF now gives investors direct exposure. Fast settlement. Institutional custody. Simple access.
Explore how this launch could reshape portfolios
Sponsored ContentNew: Manage All Your Stock Portfolios in One Place
We've created the ultimate portfolio companion for stock investors, and it's free.
• Connect an unlimited number of Portfolios and see your total in one currency
• Be alerted to new Warning Signs or Risks via email or mobile
• Track the Fair Value of your stocks
Have feedback on this article? Concerned about the content? Get in touch with us directly. Alternatively, email editorial-team (at) simplywallst.com.
This article by Simply Wall St is general in nature. We provide commentary based on historical data and analyst forecasts only using an unbiased methodology and our articles are not intended to be financial advice. It does not constitute a recommendation to buy or sell any stock, and does not take account of your objectives, or your financial situation. We aim to bring you long-term focused analysis driven by fundamental data. Note that our analysis may not factor in the latest price-sensitive company announcements or qualitative material. Simply Wall St has no position in any stocks mentioned.
About OM:GAPW B
Gapwaves
Designs, develops, manufactures, and delivers waveguide products in Sweden, rest of European Union, and internationally.
Flawless balance sheet with high growth potential.
Market Insights

Weekly Picks

Early mover in a fast growing industry. Likely to experience share price volatility as they scale


A case for CA$31.80 (undiluted), aka 8,616% upside from CA$0.37 (an 86 bagger!).


Moderation and Stabilisation: HOLD: Fair Price based on a 4-year Cycle is $12.08
Recently Updated Narratives

Automotive Electronics Manufacturer Consistent and Stable

Airbnb Stock: Platform Growth in a World of Saturation and Scrutiny

Adobe Stock: AI-Fueled ARR Growth Pushes Guidance Higher, But Cost Pressures Loom
Popular Narratives


Crazy Undervalued 42 Baggers Silver Play (Active & Running Mine)


NVDA: Expanding AI Demand Will Drive Major Data Center Investments Through 2026

The AI Infrastructure Giant Grows Into Its Valuation
Trending Discussion


