
Legendary fund manager Li Lu (who Charlie Munger backed) once said, 'The biggest investment risk is not the volatility of prices, but whether you will suffer a permanent loss of capital.' So it might be obvious that you need to consider debt, when you think about how risky any given stock is, because too much debt can sink a company. We note that Free2move Holding AB (publ) (NGM:F2M) does have debt on its balance sheet. But is this debt a concern to shareholders?
When Is Debt A Problem?
Debt and other liabilities become risky for a business when it cannot easily fulfill those obligations, either with free cash flow or by raising capital at an attractive price. Ultimately, if the company can't fulfill its legal obligations to repay debt, shareholders could walk away with nothing. While that is not too common, we often do see indebted companies permanently diluting shareholders because lenders force them to raise capital at a distressed price. Of course, the upside of debt is that it often represents cheap capital, especially when it replaces dilution in a company with the ability to reinvest at high rates of return. The first thing to do when considering how much debt a business uses is to look at its cash and debt together.
See our latest analysis for Free2move Holding
How Much Debt Does Free2move Holding Carry?
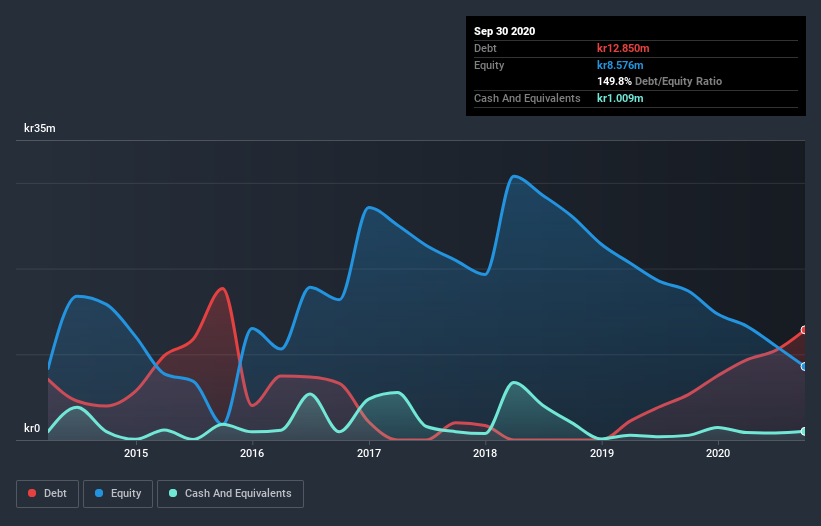
The image below, which you can click on for greater detail, shows that at September 2020 Free2move Holding had debt of kr12.9m, up from kr5.30m in one year. However, because it has a cash reserve of kr1.01m, its net debt is less, at about kr11.8m.
How Healthy Is Free2move Holding's Balance Sheet?
The latest balance sheet data shows that Free2move Holding had liabilities of kr8.07m due within a year, and liabilities of kr12.9m falling due after that. Offsetting these obligations, it had cash of kr1.01m as well as receivables valued at kr590.0k due within 12 months. So its liabilities total kr19.3m more than the combination of its cash and short-term receivables.
This deficit is considerable relative to its market capitalization of kr24.2m, so it does suggest shareholders should keep an eye on Free2move Holding's use of debt. This suggests shareholders would be heavily diluted if the company needed to shore up its balance sheet in a hurry. When analysing debt levels, the balance sheet is the obvious place to start. But it is Free2move Holding's earnings that will influence how the balance sheet holds up in the future. So when considering debt, it's definitely worth looking at the earnings trend. Click here for an interactive snapshot.
In the last year Free2move Holding wasn't profitable at an EBIT level, but managed to grow its revenue by 153%, to kr5.4m. So its pretty obvious shareholders are hoping for more growth!
Caveat Emptor
Even though Free2move Holding managed to grow its top line quite deftly, the cold hard truth is that it is losing money on the EBIT line. Indeed, it lost a very considerable kr7.9m at the EBIT level. Considering that alongside the liabilities mentioned above does not give us much confidence that company should be using so much debt. So we think its balance sheet is a little strained, though not beyond repair. Another cause for caution is that is bled kr7.1m in negative free cash flow over the last twelve months. So suffice it to say we consider the stock very risky. There's no doubt that we learn most about debt from the balance sheet. But ultimately, every company can contain risks that exist outside of the balance sheet. For instance, we've identified 5 warning signs for Free2move Holding (4 are significant) you should be aware of.
Of course, if you're the type of investor who prefers buying stocks without the burden of debt, then don't hesitate to discover our exclusive list of net cash growth stocks, today.
If you decide to trade Free2move Holding, use the lowest-cost* platform that is rated #1 Overall by Barron’s, Interactive Brokers. Trade stocks, options, futures, forex, bonds and funds on 135 markets, all from a single integrated account. Promoted
Mobile Infrastructure for Defense and Disaster
The next wave in robotics isn't humanoid. Its fully autonomous towers delivering 5G, ISR, and radar in under 30 minutes, anywhere.
Get the investor briefing before the next round of contracts
Sponsored On Behalf of CiTechNew: AI Stock Screener & Alerts
Our new AI Stock Screener scans the market every day to uncover opportunities.
• Dividend Powerhouses (3%+ Yield)
• Undervalued Small Caps with Insider Buying
• High growth Tech and AI Companies
Or build your own from over 50 metrics.
This article by Simply Wall St is general in nature. It does not constitute a recommendation to buy or sell any stock, and does not take account of your objectives, or your financial situation. We aim to bring you long-term focused analysis driven by fundamental data. Note that our analysis may not factor in the latest price-sensitive company announcements or qualitative material. Simply Wall St has no position in any stocks mentioned.
*Interactive Brokers Rated Lowest Cost Broker by StockBrokers.com Annual Online Review 2020
Have feedback on this article? Concerned about the content? Get in touch with us directly. Alternatively, email editorial-team (at) simplywallst.com.
About NGM:F2M
Free2move Holding
Operates as a knowledge partner and IT consultant within property technologies in Sweden.
Moderate risk and good value.
Market Insights

Weekly Picks

Early mover in a fast growing industry. Likely to experience share price volatility as they scale


A case for CA$31.80 (undiluted), aka 8,616% upside from CA$0.37 (an 86 bagger!).


Moderation and Stabilisation: HOLD: Fair Price based on a 4-year Cycle is $12.08
Recently Updated Narratives

Airbnb Stock: Platform Growth in a World of Saturation and Scrutiny

Adobe Stock: AI-Fueled ARR Growth Pushes Guidance Higher, But Cost Pressures Loom

Thomson Reuters Stock: When Legal Intelligence Becomes Mission-Critical Infrastructure
Popular Narratives


Crazy Undervalued 42 Baggers Silver Play (Active & Running Mine)


NVDA: Expanding AI Demand Will Drive Major Data Center Investments Through 2026

The AI Infrastructure Giant Grows Into Its Valuation
Trending Discussion

