
Advertisement
mySafety Group (STO:SAFETY B) Takes On Some Risk With Its Use Of Debt
Howard Marks put it nicely when he said that, rather than worrying about share price volatility, 'The possibility of permanent loss is the risk I worry about... and every practical investor I know worries about.' So it might be obvious that you need to consider debt, when you think about how risky any given stock is, because too much debt can sink a company. As with many other companies mySafety Group AB (STO:SAFETY B) makes use of debt. But should shareholders be worried about its use of debt?
When Is Debt A Problem?
Debt and other liabilities become risky for a business when it cannot easily fulfill those obligations, either with free cash flow or by raising capital at an attractive price. Part and parcel of capitalism is the process of 'creative destruction' where failed businesses are mercilessly liquidated by their bankers. While that is not too common, we often do see indebted companies permanently diluting shareholders because lenders force them to raise capital at a distressed price. Having said that, the most common situation is where a company manages its debt reasonably well - and to its own advantage. The first thing to do when considering how much debt a business uses is to look at its cash and debt together.
View our latest analysis for mySafety Group
How Much Debt Does mySafety Group Carry?
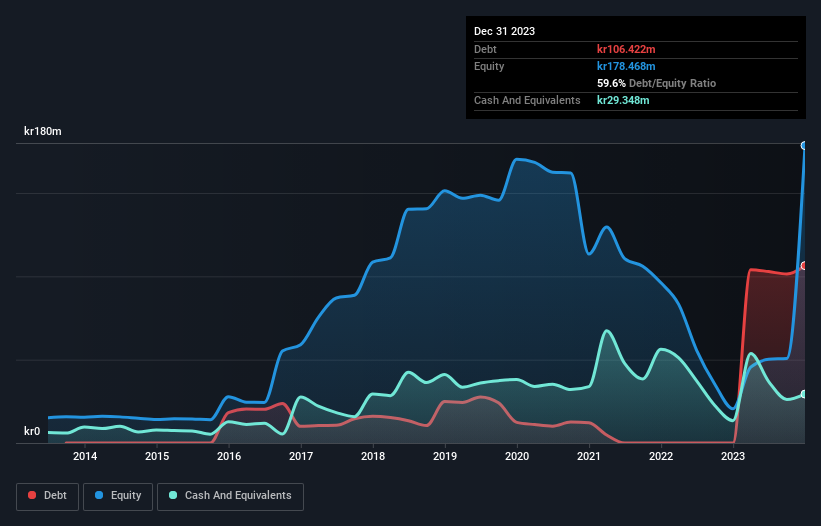
The image below, which you can click on for greater detail, shows that at December 2023 mySafety Group had debt of kr106.4m, up from none in one year. However, it also had kr29.3m in cash, and so its net debt is kr77.1m.
How Healthy Is mySafety Group's Balance Sheet?
The latest balance sheet data shows that mySafety Group had liabilities of kr191.1m due within a year, and liabilities of kr122.7m falling due after that. Offsetting this, it had kr29.3m in cash and kr158.4m in receivables that were due within 12 months. So it has liabilities totalling kr126.0m more than its cash and near-term receivables, combined.
When you consider that this deficiency exceeds the company's kr107.2m market capitalization, you might well be inclined to review the balance sheet intently. In the scenario where the company had to clean up its balance sheet quickly, it seems likely shareholders would suffer extensive dilution.
We measure a company's debt load relative to its earnings power by looking at its net debt divided by its earnings before interest, tax, depreciation, and amortization (EBITDA) and by calculating how easily its earnings before interest and tax (EBIT) cover its interest expense (interest cover). This way, we consider both the absolute quantum of the debt, as well as the interest rates paid on it.
mySafety Group's net debt is only 0.42 times its EBITDA. And its EBIT easily covers its interest expense, being 13.6 times the size. So you could argue it is no more threatened by its debt than an elephant is by a mouse. Although mySafety Group made a loss at the EBIT level, last year, it was also good to see that it generated kr137m in EBIT over the last twelve months. When analysing debt levels, the balance sheet is the obvious place to start. But it is mySafety Group's earnings that will influence how the balance sheet holds up in the future. So when considering debt, it's definitely worth looking at the earnings trend. Click here for an interactive snapshot.
But our final consideration is also important, because a company cannot pay debt with paper profits; it needs cold hard cash. So it is important to check how much of its earnings before interest and tax (EBIT) converts to actual free cash flow. Over the last year, mySafety Group recorded negative free cash flow, in total. Debt is usually more expensive, and almost always more risky in the hands of a company with negative free cash flow. Shareholders ought to hope for an improvement.
Our View
Mulling over mySafety Group's attempt at converting EBIT to free cash flow, we're certainly not enthusiastic. But at least it's pretty decent at covering its interest expense with its EBIT; that's encouraging. Once we consider all the factors above, together, it seems to us that mySafety Group's debt is making it a bit risky. That's not necessarily a bad thing, but we'd generally feel more comfortable with less leverage. The balance sheet is clearly the area to focus on when you are analysing debt. However, not all investment risk resides within the balance sheet - far from it. For example, we've discovered 5 warning signs for mySafety Group (4 make us uncomfortable!) that you should be aware of before investing here.
If you're interested in investing in businesses that can grow profits without the burden of debt, then check out this free list of growing businesses that have net cash on the balance sheet.
New: AI Stock Screener & Alerts
Our new AI Stock Screener scans the market every day to uncover opportunities.
• Dividend Powerhouses (3%+ Yield)
• Undervalued Small Caps with Insider Buying
• High growth Tech and AI Companies
Or build your own from over 50 metrics.
Have feedback on this article? Concerned about the content? Get in touch with us directly. Alternatively, email editorial-team (at) simplywallst.com.
This article by Simply Wall St is general in nature. We provide commentary based on historical data and analyst forecasts only using an unbiased methodology and our articles are not intended to be financial advice. It does not constitute a recommendation to buy or sell any stock, and does not take account of your objectives, or your financial situation. We aim to bring you long-term focused analysis driven by fundamental data. Note that our analysis may not factor in the latest price-sensitive company announcements or qualitative material. Simply Wall St has no position in any stocks mentioned.
About OM:SAFETY B
Adequate balance sheet second-rate dividend payer.
Market Insights

Advertisement
Community Narratives
The company that turned a verb into a global necessity and basically runs the modern internet, digital ads, smartphones, maps, and AI.
Fair Value US$300.00|8.5% undervalued
OS
Community Contributor
Flowers Foods Pays A Fair Price For Health
Fair Value US$16.12|24.6% undervalued
NV
Community Contributor
TMX Group will thrive with 33.3% profit margin and enduring market moat
Fair Value CA$49.90|0.1% undervalued
LI
Community Contributor