
Advertisement
Little Excitement Around mySafety Group AB's (STO:SAFETY B) Revenues As Shares Take 34% Pounding
mySafety Group AB (STO:SAFETY B) shareholders that were waiting for something to happen have been dealt a blow with a 34% share price drop in the last month. Instead of being rewarded, shareholders who have already held through the last twelve months are now sitting on a 46% share price drop.
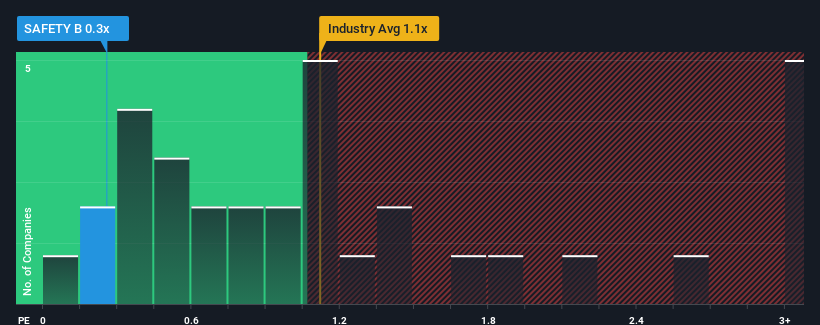
Following the heavy fall in price, it would be understandable if you think mySafety Group is a stock with good investment prospects with a price-to-sales ratios (or "P/S") of 0.3x, considering almost half the companies in Sweden's IT industry have P/S ratios above 1.1x. Nonetheless, we'd need to dig a little deeper to determine if there is a rational basis for the reduced P/S.
Check out our latest analysis for mySafety Group
How mySafety Group Has Been Performing
Recent times have been quite advantageous for mySafety Group as its revenue has been rising very briskly. One possibility is that the P/S ratio is low because investors think this strong revenue growth might actually underperform the broader industry in the near future. Those who are bullish on mySafety Group will be hoping that this isn't the case, so that they can pick up the stock at a lower valuation.
We don't have analyst forecasts, but you can see how recent trends are setting up the company for the future by checking out our free report on mySafety Group's earnings, revenue and cash flow.How Is mySafety Group's Revenue Growth Trending?
There's an inherent assumption that a company should underperform the industry for P/S ratios like mySafety Group's to be considered reasonable.
Retrospectively, the last year delivered an explosive gain to the company's top line. In spite of this unbelievable short-term growth, the latest three year period hasn't been as great in aggregate as it didn't manage to provide any growth at all. So it appears to us that the company has had a mixed result in terms of growing revenue over that time.
Comparing that to the industry, which is predicted to deliver 14% growth in the next 12 months, the company's momentum is weaker, based on recent medium-term annualised revenue results.
With this in consideration, it's easy to understand why mySafety Group's P/S falls short of the mark set by its industry peers. Apparently many shareholders weren't comfortable holding on to something they believe will continue to trail the wider industry.
The Key Takeaway
mySafety Group's P/S has taken a dip along with its share price. It's argued the price-to-sales ratio is an inferior measure of value within certain industries, but it can be a powerful business sentiment indicator.
As we suspected, our examination of mySafety Group revealed its three-year revenue trends are contributing to its low P/S, given they look worse than current industry expectations. Right now shareholders are accepting the low P/S as they concede future revenue probably won't provide any pleasant surprises. If recent medium-term revenue trends continue, it's hard to see the share price experience a reversal of fortunes anytime soon.
It's always necessary to consider the ever-present spectre of investment risk. We've identified 6 warning signs with mySafety Group (at least 4 which are a bit concerning), and understanding these should be part of your investment process.
If you're unsure about the strength of mySafety Group's business, why not explore our interactive list of stocks with solid business fundamentals for some other companies you may have missed.
New: AI Stock Screener & Alerts
Our new AI Stock Screener scans the market every day to uncover opportunities.
• Dividend Powerhouses (3%+ Yield)
• Undervalued Small Caps with Insider Buying
• High growth Tech and AI Companies
Or build your own from over 50 metrics.
Have feedback on this article? Concerned about the content? Get in touch with us directly. Alternatively, email editorial-team (at) simplywallst.com.
This article by Simply Wall St is general in nature. We provide commentary based on historical data and analyst forecasts only using an unbiased methodology and our articles are not intended to be financial advice. It does not constitute a recommendation to buy or sell any stock, and does not take account of your objectives, or your financial situation. We aim to bring you long-term focused analysis driven by fundamental data. Note that our analysis may not factor in the latest price-sensitive company announcements or qualitative material. Simply Wall St has no position in any stocks mentioned.
About OM:SAFETY B
Adequate balance sheet second-rate dividend payer.
Market Insights

Advertisement
Community Narratives
The company that turned a verb into a global necessity and basically runs the modern internet, digital ads, smartphones, maps, and AI.
Fair Value US$300.00|10.8% undervalued
OS
Community Contributor
Flowers Foods Pays A Fair Price For Health
Fair Value US$16.12|22.0% undervalued
NV
Community Contributor
TMX Group will thrive with 33.3% profit margin and enduring market moat
Fair Value CA$49.90|3.8% overvalued
LI
Community Contributor