
Advertisement
Does mySafety Group (STO:SAFETY B) Have A Healthy Balance Sheet?
Some say volatility, rather than debt, is the best way to think about risk as an investor, but Warren Buffett famously said that 'Volatility is far from synonymous with risk.' When we think about how risky a company is, we always like to look at its use of debt, since debt overload can lead to ruin. We can see that mySafety Group AB (STO:SAFETY B) does use debt in its business. But the more important question is: how much risk is that debt creating?
When Is Debt Dangerous?
Debt and other liabilities become risky for a business when it cannot easily fulfill those obligations, either with free cash flow or by raising capital at an attractive price. In the worst case scenario, a company can go bankrupt if it cannot pay its creditors. While that is not too common, we often do see indebted companies permanently diluting shareholders because lenders force them to raise capital at a distressed price. Of course, the upside of debt is that it often represents cheap capital, especially when it replaces dilution in a company with the ability to reinvest at high rates of return. The first step when considering a company's debt levels is to consider its cash and debt together.
View our latest analysis for mySafety Group
What Is mySafety Group's Debt?
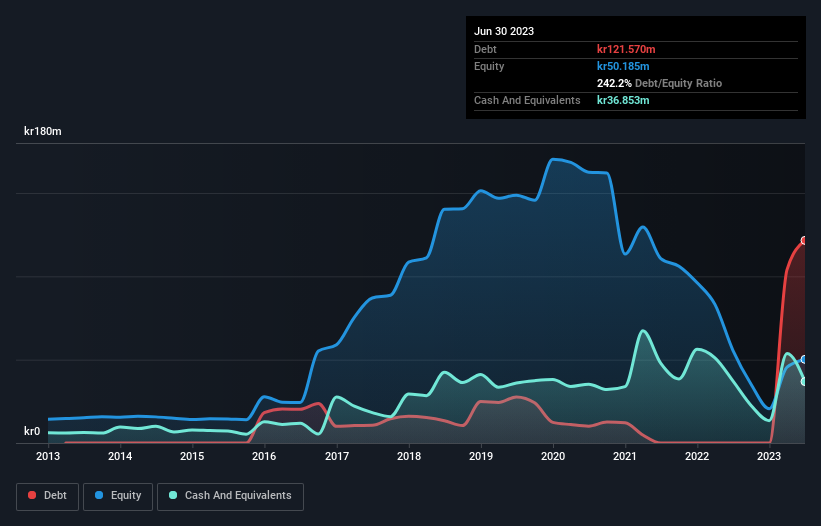
As you can see below, at the end of June 2023, mySafety Group had kr121.6m of debt, up from none a year ago. Click the image for more detail. However, because it has a cash reserve of kr36.9m, its net debt is less, at about kr84.7m.
How Healthy Is mySafety Group's Balance Sheet?
Zooming in on the latest balance sheet data, we can see that mySafety Group had liabilities of kr196.4m due within 12 months and liabilities of kr105.5m due beyond that. On the other hand, it had cash of kr36.9m and kr145.2m worth of receivables due within a year. So it has liabilities totalling kr119.9m more than its cash and near-term receivables, combined.
When you consider that this deficiency exceeds the company's kr86.6m market capitalization, you might well be inclined to review the balance sheet intently. Hypothetically, extremely heavy dilution would be required if the company were forced to pay down its liabilities by raising capital at the current share price.
We use two main ratios to inform us about debt levels relative to earnings. The first is net debt divided by earnings before interest, tax, depreciation, and amortization (EBITDA), while the second is how many times its earnings before interest and tax (EBIT) covers its interest expense (or its interest cover, for short). Thus we consider debt relative to earnings both with and without depreciation and amortization expenses.
mySafety Group shareholders face the double whammy of a high net debt to EBITDA ratio (10.3), and fairly weak interest coverage, since EBIT is just 0.51 times the interest expense. The debt burden here is substantial. However, the silver lining was that mySafety Group achieved a positive EBIT of kr2.1m in the last twelve months, an improvement on the prior year's loss. The balance sheet is clearly the area to focus on when you are analysing debt. But it is mySafety Group's earnings that will influence how the balance sheet holds up in the future. So when considering debt, it's definitely worth looking at the earnings trend. Click here for an interactive snapshot.
Finally, a business needs free cash flow to pay off debt; accounting profits just don't cut it. So it is important to check how much of its earnings before interest and tax (EBIT) converts to actual free cash flow. During the last year, mySafety Group burned a lot of cash. While that may be a result of expenditure for growth, it does make the debt far more risky.
Our View
On the face of it, mySafety Group's interest cover left us tentative about the stock, and its conversion of EBIT to free cash flow was no more enticing than the one empty restaurant on the busiest night of the year. Having said that, its ability to grow its EBIT isn't such a worry. Taking into account all the aforementioned factors, it looks like mySafety Group has too much debt. That sort of riskiness is ok for some, but it certainly doesn't float our boat. There's no doubt that we learn most about debt from the balance sheet. But ultimately, every company can contain risks that exist outside of the balance sheet. Be aware that mySafety Group is showing 3 warning signs in our investment analysis , and 2 of those are a bit concerning...
When all is said and done, sometimes its easier to focus on companies that don't even need debt. Readers can access a list of growth stocks with zero net debt 100% free, right now.
New: AI Stock Screener & Alerts
Our new AI Stock Screener scans the market every day to uncover opportunities.
• Dividend Powerhouses (3%+ Yield)
• Undervalued Small Caps with Insider Buying
• High growth Tech and AI Companies
Or build your own from over 50 metrics.
Have feedback on this article? Concerned about the content? Get in touch with us directly. Alternatively, email editorial-team (at) simplywallst.com.
This article by Simply Wall St is general in nature. We provide commentary based on historical data and analyst forecasts only using an unbiased methodology and our articles are not intended to be financial advice. It does not constitute a recommendation to buy or sell any stock, and does not take account of your objectives, or your financial situation. We aim to bring you long-term focused analysis driven by fundamental data. Note that our analysis may not factor in the latest price-sensitive company announcements or qualitative material. Simply Wall St has no position in any stocks mentioned.
About OM:SAFETY B
Adequate balance sheet second-rate dividend payer.
Market Insights

Advertisement
Community Narratives
Finding The True Value Of A Logistics Powerhouse
Fair Value US$95.21|8.6% undervalued
NV
Community Contributor
Paradigm Biopharmaceuticals Will Lead Osteoarthritis Treatment with Zilosul's FDA Success
Fair Value AU$5.50|91.9% undervalued
AM
Community Contributor
Barrick Mining (ABX:CA): A Gold Hedge against a U.S. Shutdown
Fair Value CA$60.00|25.6% undervalued
GM
Community Contributor