Advertisement
Proact IT Group (OM:PACT) Margin Compression Challenges Bullish Cloud And AI Narratives
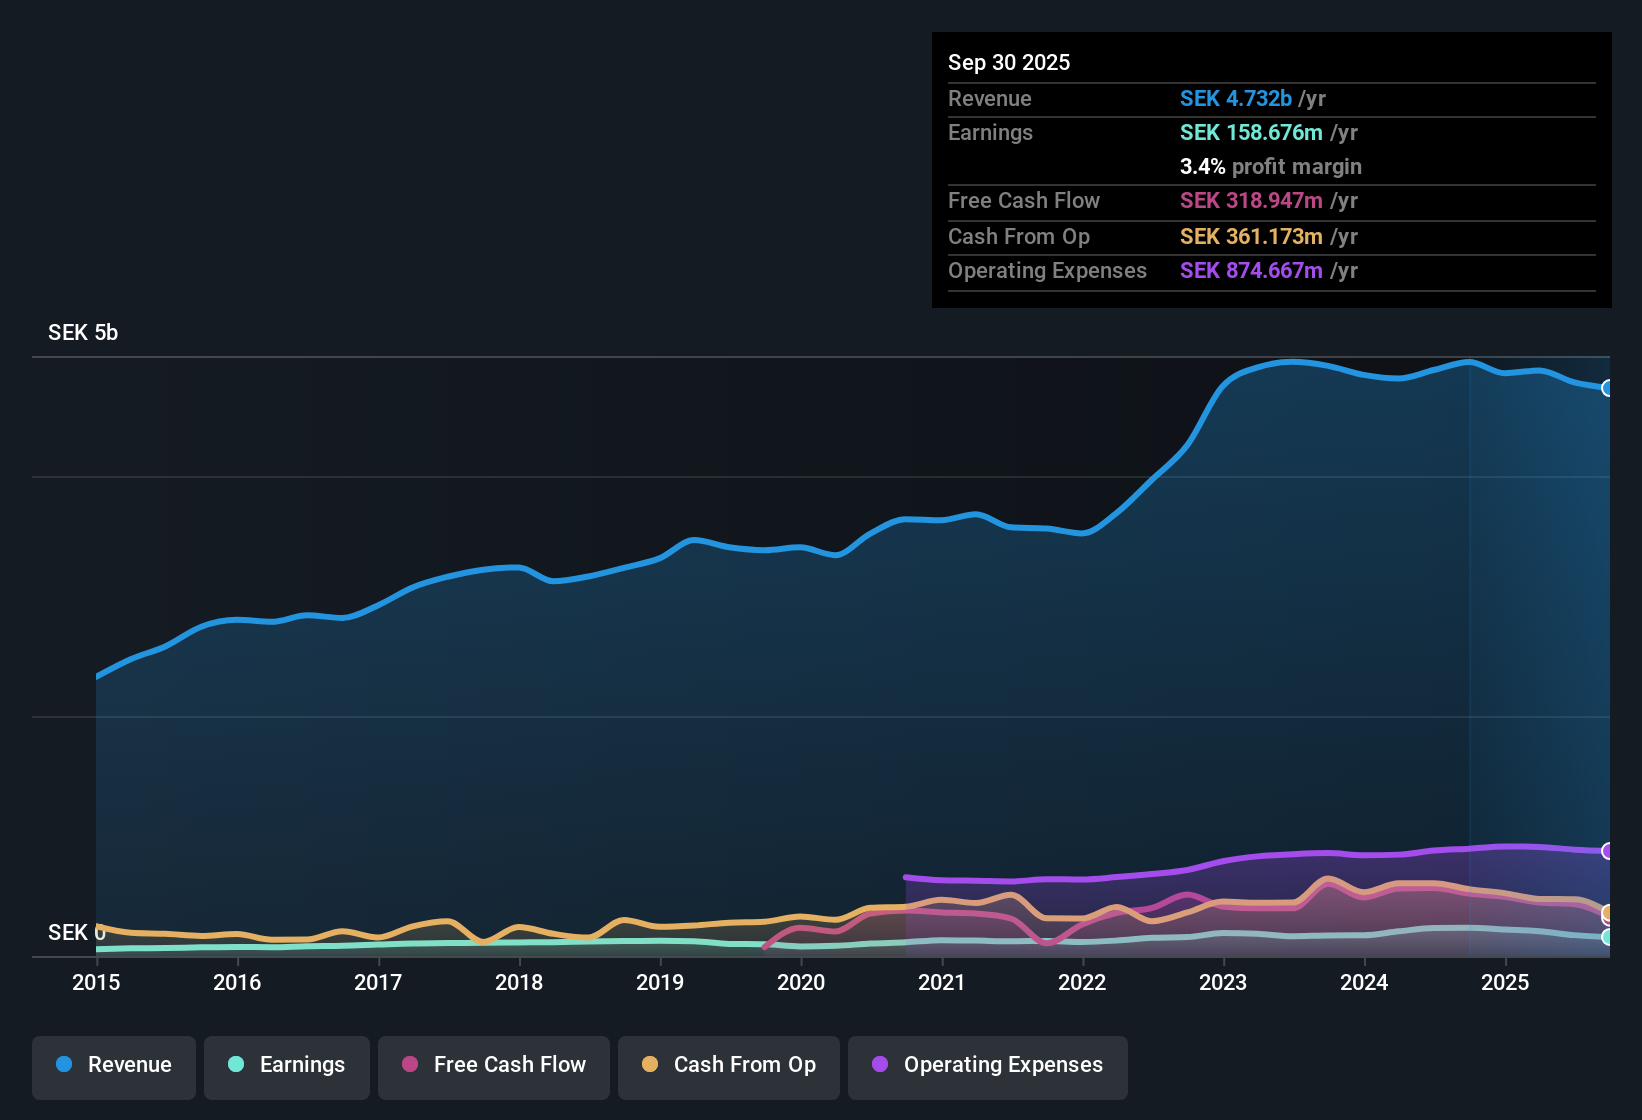
Proact IT Group (OM:PACT) has wrapped up FY 2025 with Q4 revenue of SEK1.2b and EPS of SEK0.56, capping a year where trailing twelve month revenue came in at SEK4.7b and EPS at SEK4.67. Over recent periods the company has seen quarterly revenue range between SEK1.1b and SEK1.3b, while quarterly EPS has moved from SEK0.56 to SEK1.92. This is setting the scene for investors to focus closely on how compressed margins and a weaker net profit margin profile frame the quality of these results.
See our full analysis for Proact IT Group.With the headline numbers on the table, the next step is to weigh them against the widely followed narratives around Proact IT Group, to see which stories still hold up and which are being questioned by the latest margin trends.
See what the community is saying about Proact IT Group
Margins Under Pressure At 2.6% Net
- Over the last 12 months, Proact IT Group converted SEK4.7b of revenue into SEK122.7 million of net income, which equates to a 2.6% net profit margin compared with 4.5% in the prior year period.
- Analysts' consensus view that higher margin cloud, cybersecurity and AI services can improve profitability sits against this margin picture,
- Consensus highlights the focus on cloud services and value added offerings as a potential support for net margins, while the reported margin decline and SEK84.0 million one off loss show that recent profitability has been sensitive to specific hits.
- The decentralized model is described as helping Proact adapt to regional needs, yet lower systems revenue and integration costs in some regions are cited as weighing on EBITA margins, which lines up with the weaker 2.6% net margin in the data.
EPS Trend And One Off Loss Impact
- Trailing twelve month EPS moved from 8.71 SEK at 2024 Q3 to 4.67 SEK at 2025 Q4, with the period also including a SEK84.0 million one off loss that materially affected reported earnings.
- Critics highlight that temporary declines in systems sales and integration costs could keep pressure on profits, and the earnings trend gives them some support,
- The consensus narrative points to slower systems revenue in units like NOBA and Central and notes that these pressures have hurt EBITA margins, which is consistent with EPS in the last four reported quarters ranging between 0.56 SEK and 1.79 SEK.
- Bears also refer to slower growth in markets such as Germany, and the trailing move from SEK207.2 million to SEK122.7 million of net income over the last six trailing data points shows that recent profitability has not matched earlier periods in the dataset.
P/E Premium Versus DCF Fair Value
- At a share price of SEK104, the stock trades on a trailing P/E of 21.8x compared with peer and European IT averages of 18.1x and 19.4x, while a DCF fair value in the data is SEK273.74.
- What is interesting is how the bullish view on long term growth interacts with this higher P/E and large DCF gap,
- Consensus expects earnings to grow around 18.3% per year with revenue at about 2.4% per year, and also cites a focus on cloud, cybersecurity and AI as potential drivers, which helps explain why some investors might still accept a P/E premium.
- At the same time, the same dataset flags an unstable dividend track record and the recent margin drop from 4.5% to 2.6%, so the 21.8x P/E sits alongside both the DCF fair value of SEK273.74 and these risk markers rather than only the growth outlook.
Next Steps
To see how these results tie into long-term growth, risks, and valuation, check out the full range of community narratives for Proact IT Group on Simply Wall St. Add the company to your watchlist or portfolio so you'll be alerted when the story evolves.
See the numbers differently? Take a couple of minutes to test your view against the data and shape your own story around Proact IT Group, then Do it your way.
A great starting point for your Proact IT Group research is our analysis highlighting 2 key rewards and 3 important warning signs that could impact your investment decision.
Explore Alternatives
With net profit margins narrowing to 2.6%, earnings pressured by a SEK84.0 million one off loss and a higher 21.8x P/E, Proact IT Group carries clear profitability and valuation questions.
If those pressures make you want a stronger price to earnings story, take a look at our 222 high quality undervalued stocks that screens for companies where fundamentals and valuation line up more comfortably.
This article by Simply Wall St is general in nature. We provide commentary based on historical data and analyst forecasts only using an unbiased methodology and our articles are not intended to be financial advice. It does not constitute a recommendation to buy or sell any stock, and does not take account of your objectives, or your financial situation. We aim to bring you long-term focused analysis driven by fundamental data. Note that our analysis may not factor in the latest price-sensitive company announcements or qualitative material. Simply Wall St has no position in any stocks mentioned.
New: Manage All Your Stock Portfolios in One Place
We've created the ultimate portfolio companion for stock investors, and it's free.
• Connect an unlimited number of Portfolios and see your total in one currency
• Be alerted to new Warning Signs or Risks via email or mobile
• Track the Fair Value of your stocks
Have feedback on this article? Concerned about the content? Get in touch with us directly. Alternatively, email editorial-team@simplywallst.com
About OM:PACT
Proact IT Group
Provides data and information management services with cloud services and data center solutions in Sweden, the United Kingdom, the Netherlands, Germany, and internationally.
Excellent balance sheet with reasonable growth potential and pays a dividend.
Market Insights


Advertisement
Weekly Picks
LO


Lou_Basenese on Gain Therapeutics ·
The Market Is Sleeping on This Parkinson's Biotech - And I Think That's a Mistake
Fair Value:US$7.673.0% undervalued
25 followersusers have followed this narrative
0 commentsusers have commented on this narrative
17 likesusers have liked this narrative
KI

Kingman1152 on NVIDIA ·
NVIDIA will see a profit margin surge of 55% in the next 5 years
Fair Value:US$305.235.0% undervalued
52 followersusers have followed this narrative
1 commentusers have commented on this narrative
17 likesusers have liked this narrative
TE

TechMegaTrends on Bambuser ·
Bambuser is today the only listed company in Europe that simultaneously possesses an 85% gross margin, proprietary AI infrastructure for the
Fair Value:SEK 238.2687.2% undervalued
33 followersusers have followed this narrative
0 commentsusers have commented on this narrative
14 likesusers have liked this narrative
HE


HedgeY on Constellium ·
Constellium jet another cyclical aluminum processor, or a mispriced aluminum platform?
Fair Value:US$3412.8% undervalued
5 followersusers have followed this narrative
0 commentsusers have commented on this narrative
4 likesusers have liked this narrative
Recently Updated Narratives
DA


davidlsander on Ubisoft Entertainment ·
Is Ubisoft the Market’s Biggest Pricing Error? Why Forensic Value Points to €33 Per Share
Fair Value:€33.886.0% undervalued
76 followersusers have followed this narrative
7 commentsusers have commented on this narrative
1 likeusers have liked this narrative
FA

FA_Trader on PMCK Berhad ·
Sunway Healthcare’s valuation spike may shine light on smaller healthcare names like PMCK
Fair Value:RM 0.2623.1% undervalued
1 followerusers have followed this narrative
0 commentsusers have commented on this narrative
0 likesusers have liked this narrative
CG

CG86 on Bausch + Lomb ·
$BLCO & $COO The Silence BEFORE the AGM: A Retail Investor’s Timeline, Findings, and Opinion on SUSPICIOUS SILENCE!
Fair Value:US$39.2357.7% undervalued
1 followerusers have followed this narrative
0 commentsusers have commented on this narrative
0 likesusers have liked this narrative
Popular Narratives
TR


tripledub on Microsoft ·
Everyone's Terrified Microsoft Will Keep Spending. I'm Terrified They'll Stop.
Fair Value:US$3956.4% overvalued
51 followersusers have followed this narrative
3 commentsusers have commented on this narrative
42 likesusers have liked this narrative
KI
Kingman1152 on NVIDIA ·
NVIDIA will see a profit margin surge of 55% in the next 5 years
Fair Value:US$305.235.0% undervalued
52 followersusers have followed this narrative
1 commentusers have commented on this narrative
17 likesusers have liked this narrative
AN

AnalystConsensusTarget on Microsoft ·
Analyst Commentary Highlights Microsoft AI Momentum and Upward Valuation Amid Growth and Competitive Risks
Fair Value:US$587.3128.4% undervalued
1365 followersusers have followed this narrative
2 commentsusers have commented on this narrative
11 likesusers have liked this narrative


