Advertisement
David Iben put it well when he said, 'Volatility is not a risk we care about. What we care about is avoiding the permanent loss of capital.' When we think about how risky a company is, we always like to look at its use of debt, since debt overload can lead to ruin. As with many other companies Lime Technologies AB (publ) (STO:LIME) makes use of debt. But the more important question is: how much risk is that debt creating?
What Risk Does Debt Bring?
Debt and other liabilities become risky for a business when it cannot easily fulfill those obligations, either with free cash flow or by raising capital at an attractive price. In the worst case scenario, a company can go bankrupt if it cannot pay its creditors. However, a more common (but still painful) scenario is that it has to raise new equity capital at a low price, thus permanently diluting shareholders. Of course, plenty of companies use debt to fund growth, without any negative consequences. When we think about a company's use of debt, we first look at cash and debt together.
View our latest analysis for Lime Technologies
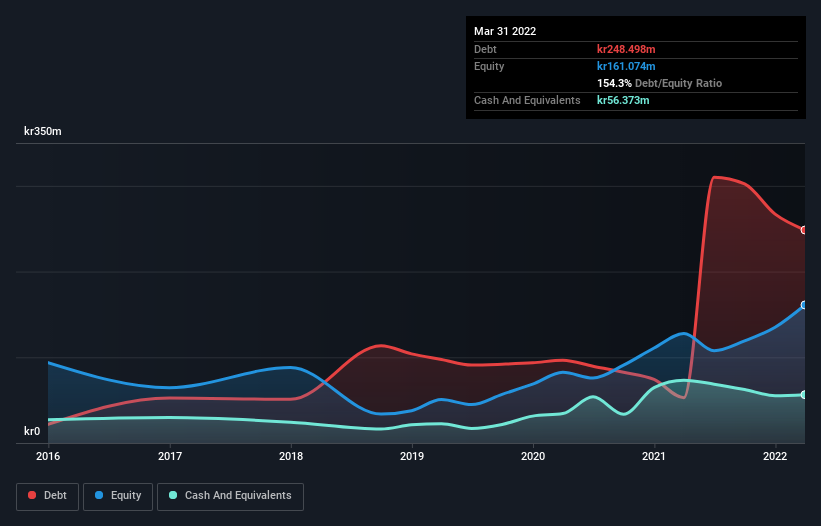
What Is Lime Technologies's Debt?
As you can see below, at the end of March 2022, Lime Technologies had kr248.5m of debt, up from kr52.8m a year ago. Click the image for more detail. However, because it has a cash reserve of kr56.4m, its net debt is less, at about kr192.1m.
How Strong Is Lime Technologies' Balance Sheet?
The latest balance sheet data shows that Lime Technologies had liabilities of kr226.3m due within a year, and liabilities of kr283.2m falling due after that. Offsetting this, it had kr56.4m in cash and kr73.3m in receivables that were due within 12 months. So its liabilities total kr379.8m more than the combination of its cash and short-term receivables.
Of course, Lime Technologies has a market capitalization of kr3.38b, so these liabilities are probably manageable. However, we do think it is worth keeping an eye on its balance sheet strength, as it may change over time.
In order to size up a company's debt relative to its earnings, we calculate its net debt divided by its earnings before interest, tax, depreciation, and amortization (EBITDA) and its earnings before interest and tax (EBIT) divided by its interest expense (its interest cover). The advantage of this approach is that we take into account both the absolute quantum of debt (with net debt to EBITDA) and the actual interest expenses associated with that debt (with its interest cover ratio).
We'd say that Lime Technologies's moderate net debt to EBITDA ratio ( being 2.2), indicates prudence when it comes to debt. And its commanding EBIT of 14.4 times its interest expense, implies the debt load is as light as a peacock feather. The bad news is that Lime Technologies saw its EBIT decline by 10% over the last year. If earnings continue to decline at that rate then handling the debt will be more difficult than taking three children under 5 to a fancy pants restaurant. When analysing debt levels, the balance sheet is the obvious place to start. But it is future earnings, more than anything, that will determine Lime Technologies's ability to maintain a healthy balance sheet going forward. So if you want to see what the professionals think, you might find this free report on analyst profit forecasts to be interesting.
Finally, while the tax-man may adore accounting profits, lenders only accept cold hard cash. So it's worth checking how much of that EBIT is backed by free cash flow. Happily for any shareholders, Lime Technologies actually produced more free cash flow than EBIT over the last three years. That sort of strong cash conversion gets us as excited as the crowd when the beat drops at a Daft Punk concert.
Our View
Happily, Lime Technologies's impressive interest cover implies it has the upper hand on its debt. But we must concede we find its EBIT growth rate has the opposite effect. All these things considered, it appears that Lime Technologies can comfortably handle its current debt levels. Of course, while this leverage can enhance returns on equity, it does bring more risk, so it's worth keeping an eye on this one. There's no doubt that we learn most about debt from the balance sheet. But ultimately, every company can contain risks that exist outside of the balance sheet. For example - Lime Technologies has 1 warning sign we think you should be aware of.
When all is said and done, sometimes its easier to focus on companies that don't even need debt. Readers can access a list of growth stocks with zero net debt 100% free, right now.
New: AI Stock Screener & Alerts
Our new AI Stock Screener scans the market every day to uncover opportunities.
• Dividend Powerhouses (3%+ Yield)
• Undervalued Small Caps with Insider Buying
• High growth Tech and AI Companies
Or build your own from over 50 metrics.
Have feedback on this article? Concerned about the content? Get in touch with us directly. Alternatively, email editorial-team (at) simplywallst.com.
This article by Simply Wall St is general in nature. We provide commentary based on historical data and analyst forecasts only using an unbiased methodology and our articles are not intended to be financial advice. It does not constitute a recommendation to buy or sell any stock, and does not take account of your objectives, or your financial situation. We aim to bring you long-term focused analysis driven by fundamental data. Note that our analysis may not factor in the latest price-sensitive company announcements or qualitative material. Simply Wall St has no position in any stocks mentioned.
About OM:LIME
Lime Technologies
Lime Technologies AB (publ) software as a service (SaaS) based customer relationship management (CRM) solutions in the Nordic region.
Outstanding track record with reasonable growth potential.
Similar Companies
Market Insights


Advertisement
Weekly Picks
ST


stuart_roberts on Upside Gold ·
An Undervalued 3.3Moz Gold Project in Canada
Fair Value:CA$5.0774.4% undervalued
213 followersusers have followed this narrative
1 commentusers have commented on this narrative
30 likesusers have liked this narrative
SI


SimpleMan887 on GameStop ·
GameStop will ace the financial crisis wave with its strategic Bitcoin investment and cash reserves
Fair Value:US$22089.4% undervalued
53 followersusers have followed this narrative
2 commentsusers have commented on this narrative
21 likesusers have liked this narrative
YI

yiannisz on Hesai Group ·
The First Real Lidar Winner
Fair Value:US$27.0716.3% undervalued
14 followersusers have followed this narrative
1 commentusers have commented on this narrative
4 likesusers have liked this narrative
TR


tripledub on Taiwan Semiconductor Manufacturing ·
The Most Wonderful Monopoly in the Most Dangerous Neighbourhood on Earth
Fair Value:US$3812.7% undervalued
10 followersusers have followed this narrative
0 commentsusers have commented on this narrative
11 likesusers have liked this narrative
Recently Updated Narratives
CG

CG86 on Bausch + Lomb ·
$BLCO & $COO The Silence BEFORE the AGM: A Retail Investor’s Timeline, Findings, and Opinion on SUSPICIOUS SILENCE!
Fair Value:US$39.2358.0% undervalued
1 followerusers have followed this narrative
0 commentsusers have commented on this narrative
0 likesusers have liked this narrative
AS


AstrisCorporateAdvisory on INTLOOP ·
Renewed focus on business investment
Fair Value:JP¥4.17k56.4% undervalued
2 followersusers have followed this narrative
0 commentsusers have commented on this narrative
0 likesusers have liked this narrative
GO

GoranLagea on Nova Ljubljanska Banka d.d ·
Nova Ljubljanska Banka d.d. future looks bright with a profit margin change of 38%
Fair Value:€36036.7% undervalued
5 followersusers have followed this narrative
0 commentsusers have commented on this narrative
0 likesusers have liked this narrative
Popular Narratives
TR

tripledub on Microsoft ·
Everyone's Terrified Microsoft Will Keep Spending. I'm Terrified They'll Stop.
Fair Value:US$3956.1% undervalued
44 followersusers have followed this narrative
3 commentsusers have commented on this narrative
42 likesusers have liked this narrative
AN

AnalystConsensusTarget on Microsoft ·
Analyst Commentary Highlights Microsoft AI Momentum and Upward Valuation Amid Growth and Competitive Risks
Fair Value:US$587.3136.9% undervalued
1350 followersusers have followed this narrative
2 commentsusers have commented on this narrative
11 likesusers have liked this narrative
RO


Robbo on Tesla ·
The academically fascinating Tesla
Fair Value:US$301.1k% overvalued
36 followersusers have followed this narrative
11 commentsusers have commented on this narrative
31 likesusers have liked this narrative
Trending Discussion

EL

Element1 on Greatland Resources ·
I can’t believe how inaccurate and out of date this site is—and people rely on it. Greatland owns tw...
0
|0
MI

Mikeymike on Auxly Cannabis Group ·
Id like to understand why they believe the profit margin is going decline so dramatically. Is it ene...
0
|0