
What trends should we look for it we want to identify stocks that can multiply in value over the long term? Amongst other things, we'll want to see two things; firstly, a growing return on capital employed (ROCE) and secondly, an expansion in the company's amount of capital employed. If you see this, it typically means it's a company with a great business model and plenty of profitable reinvestment opportunities. Speaking of which, we noticed some great changes in Nelly Group's (STO:NELLY) returns on capital, so let's have a look.
Return On Capital Employed (ROCE): What Is It?
For those who don't know, ROCE is a measure of a company's yearly pre-tax profit (its return), relative to the capital employed in the business. To calculate this metric for Nelly Group, this is the formula:
Return on Capital Employed = Earnings Before Interest and Tax (EBIT) ÷ (Total Assets - Current Liabilities)
0.25 = kr137m ÷ (kr914m - kr359m) (Based on the trailing twelve months to June 2025).
Thus, Nelly Group has an ROCE of 25%. That's a fantastic return and not only that, it outpaces the average of 10% earned by companies in a similar industry.
View our latest analysis for Nelly Group
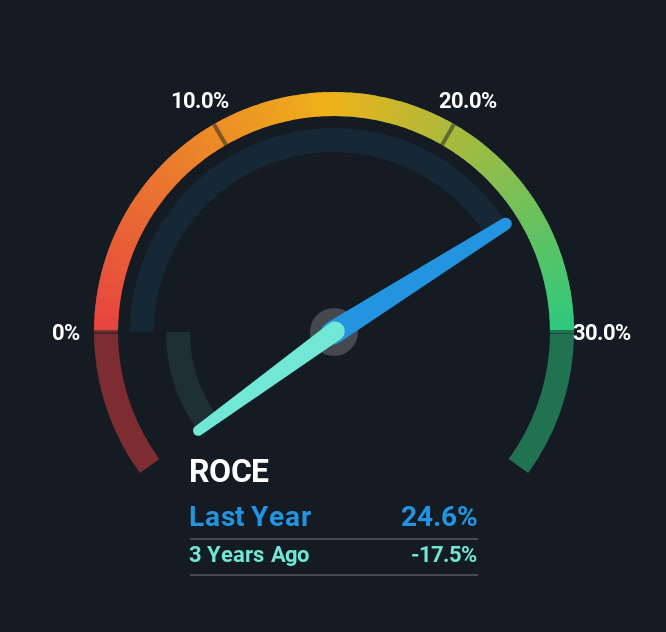
Historical performance is a great place to start when researching a stock so above you can see the gauge for Nelly Group's ROCE against it's prior returns. If you're interested in investigating Nelly Group's past further, check out this free graph covering Nelly Group's past earnings, revenue and cash flow.
The Trend Of ROCE
Like most people, we're pleased that Nelly Group is now generating some pretax earnings. The company was generating losses five years ago, but now it's turned around, earning 25% which is no doubt a relief for some early shareholders. Additionally, the business is utilizing 53% less capital than it was five years ago, and taken at face value, that can mean the company needs less funds at work to get a return. The reduction could indicate that the company is selling some assets, and considering returns are up, they appear to be selling the right ones.
One more thing to note, Nelly Group has decreased current liabilities to 39% of total assets over this period, which effectively reduces the amount of funding from suppliers or short-term creditors. So this improvement in ROCE has come from the business' underlying economics, which is great to see.
Our Take On Nelly Group's ROCE
In the end, Nelly Group has proven it's capital allocation skills are good with those higher returns from less amount of capital. Since the stock has returned a staggering 289% to shareholders over the last five years, it looks like investors are recognizing these changes. In light of that, we think it's worth looking further into this stock because if Nelly Group can keep these trends up, it could have a bright future ahead.
One more thing to note, we've identified 1 warning sign with Nelly Group and understanding this should be part of your investment process.
High returns are a key ingredient to strong performance, so check out our free list ofstocks earning high returns on equity with solid balance sheets.
Mobile Infrastructure for Defense and Disaster
The next wave in robotics isn't humanoid. Its fully autonomous towers delivering 5G, ISR, and radar in under 30 minutes, anywhere.
Get the investor briefing before the next round of contracts
Sponsored On Behalf of CiTechValuation is complex, but we're here to simplify it.
Discover if Nelly Group might be undervalued or overvalued with our detailed analysis, featuring fair value estimates, potential risks, dividends, insider trades, and its financial condition.
Access Free AnalysisHave feedback on this article? Concerned about the content? Get in touch with us directly. Alternatively, email editorial-team (at) simplywallst.com.
This article by Simply Wall St is general in nature. We provide commentary based on historical data and analyst forecasts only using an unbiased methodology and our articles are not intended to be financial advice. It does not constitute a recommendation to buy or sell any stock, and does not take account of your objectives, or your financial situation. We aim to bring you long-term focused analysis driven by fundamental data. Note that our analysis may not factor in the latest price-sensitive company announcements or qualitative material. Simply Wall St has no position in any stocks mentioned.
About OM:NELLY
Nelly Group
Operates as a fashion company in Sweden, rest of Nordics, and internationally.
Flawless balance sheet with solid track record.
Market Insights

Weekly Picks

Early mover in a fast growing industry. Likely to experience share price volatility as they scale


A case for CA$31.80 (undiluted), aka 8,616% upside from CA$0.37 (an 86 bagger!).


Moderation and Stabilisation: HOLD: Fair Price based on a 4-year Cycle is $12.08
Recently Updated Narratives

Airbnb Stock: Platform Growth in a World of Saturation and Scrutiny

Adobe Stock: AI-Fueled ARR Growth Pushes Guidance Higher, But Cost Pressures Loom

Thomson Reuters Stock: When Legal Intelligence Becomes Mission-Critical Infrastructure
Popular Narratives


Crazy Undervalued 42 Baggers Silver Play (Active & Running Mine)


NVDA: Expanding AI Demand Will Drive Major Data Center Investments Through 2026

The AI Infrastructure Giant Grows Into Its Valuation
Trending Discussion


