

If we want to find a stock that could multiply over the long term, what are the underlying trends we should look for? Ideally, a business will show two trends; firstly a growing return on capital employed (ROCE) and secondly, an increasing amount of capital employed. Put simply, these types of businesses are compounding machines, meaning they are continually reinvesting their earnings at ever-higher rates of return. However, after investigating Desenio Group (STO:DSNO), we don't think it's current trends fit the mold of a multi-bagger.
Return On Capital Employed (ROCE): What Is It?
If you haven't worked with ROCE before, it measures the 'return' (pre-tax profit) a company generates from capital employed in its business. To calculate this metric for Desenio Group, this is the formula:
Return on Capital Employed = Earnings Before Interest and Tax (EBIT) ÷ (Total Assets - Current Liabilities)
0.067 = kr93m ÷ (kr1.6b - kr181m) (Based on the trailing twelve months to September 2023).
So, Desenio Group has an ROCE of 6.7%. Ultimately, that's a low return and it under-performs the Specialty Retail industry average of 9.1%.
Check out our latest analysis for Desenio Group
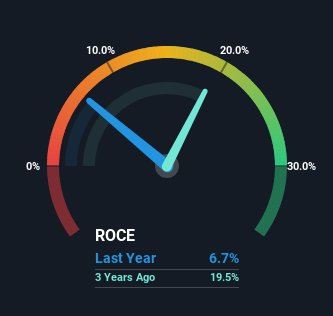
In the above chart we have measured Desenio Group's prior ROCE against its prior performance, but the future is arguably more important. If you'd like, you can check out the forecasts from the analysts covering Desenio Group here for free.
What The Trend Of ROCE Can Tell Us
When we looked at the ROCE trend at Desenio Group, we didn't gain much confidence. Around three years ago the returns on capital were 20%, but since then they've fallen to 6.7%. On the other hand, the company has been employing more capital without a corresponding improvement in sales in the last year, which could suggest these investments are longer term plays. It may take some time before the company starts to see any change in earnings from these investments.
On a related note, Desenio Group has decreased its current liabilities to 11% of total assets. That could partly explain why the ROCE has dropped. Effectively this means their suppliers or short-term creditors are funding less of the business, which reduces some elements of risk. Since the business is basically funding more of its operations with it's own money, you could argue this has made the business less efficient at generating ROCE.
The Key Takeaway
To conclude, we've found that Desenio Group is reinvesting in the business, but returns have been falling. And investors may be expecting the fundamentals to get a lot worse because the stock has crashed 85% over the last year. All in all, the inherent trends aren't typical of multi-baggers, so if that's what you're after, we think you might have more luck elsewhere.
One more thing to note, we've identified 3 warning signs with Desenio Group and understanding them should be part of your investment process.
While Desenio Group isn't earning the highest return, check out this free list of companies that are earning high returns on equity with solid balance sheets.
New: Manage All Your Stock Portfolios in One Place
We've created the ultimate portfolio companion for stock investors, and it's free.
• Connect an unlimited number of Portfolios and see your total in one currency
• Be alerted to new Warning Signs or Risks via email or mobile
• Track the Fair Value of your stocks
Have feedback on this article? Concerned about the content? Get in touch with us directly. Alternatively, email editorial-team (at) simplywallst.com.
This article by Simply Wall St is general in nature. We provide commentary based on historical data and analyst forecasts only using an unbiased methodology and our articles are not intended to be financial advice. It does not constitute a recommendation to buy or sell any stock, and does not take account of your objectives, or your financial situation. We aim to bring you long-term focused analysis driven by fundamental data. Note that our analysis may not factor in the latest price-sensitive company announcements or qualitative material. Simply Wall St has no position in any stocks mentioned.
About OM:DSNO
Desenio Group
An e-commerce company, provides affordable wall art in Sweden, Germany, France, the Netherlands, Great Britain, rest of Europe, the United States, and internationally.
Adequate balance sheet slight.
Market Insights

Community Narratives

