
Advertisement

Warren Buffett famously said, 'Volatility is far from synonymous with risk.' So it seems the smart money knows that debt - which is usually involved in bankruptcies - is a very important factor, when you assess how risky a company is. We note that Cereno Scientific AB (publ) (STO:CRNO B) does have debt on its balance sheet. But is this debt a concern to shareholders?
When Is Debt A Problem?
Generally speaking, debt only becomes a real problem when a company can't easily pay it off, either by raising capital or with its own cash flow. Ultimately, if the company can't fulfill its legal obligations to repay debt, shareholders could walk away with nothing. However, a more usual (but still expensive) situation is where a company must dilute shareholders at a cheap share price simply to get debt under control. By replacing dilution, though, debt can be an extremely good tool for businesses that need capital to invest in growth at high rates of return. When we examine debt levels, we first consider both cash and debt levels, together.
See our latest analysis for Cereno Scientific
What Is Cereno Scientific's Debt?
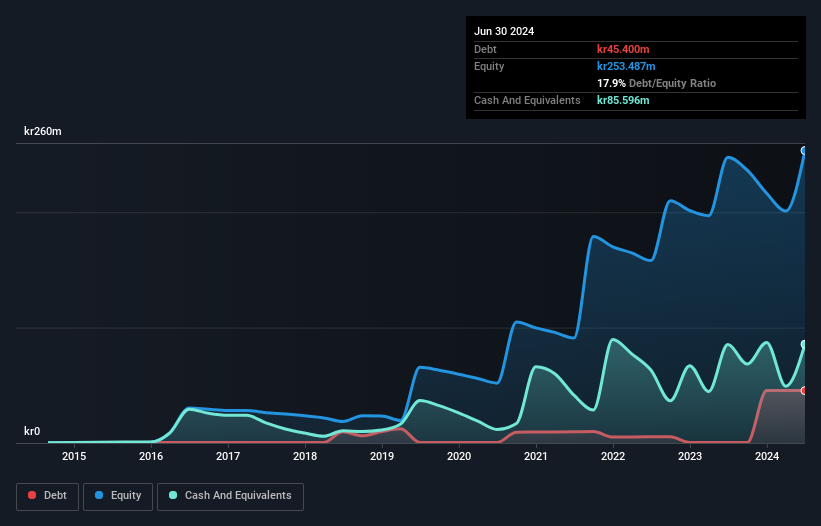
As you can see below, at the end of June 2024, Cereno Scientific had kr45.4m of debt, up from kr400.0k a year ago. Click the image for more detail. However, it does have kr85.6m in cash offsetting this, leading to net cash of kr40.2m.
How Strong Is Cereno Scientific's Balance Sheet?
Zooming in on the latest balance sheet data, we can see that Cereno Scientific had liabilities of kr33.9m due within 12 months and liabilities of kr45.4m due beyond that. Offsetting this, it had kr85.6m in cash and kr2.88m in receivables that were due within 12 months. So it can boast kr9.18m more liquid assets than total liabilities.
Having regard to Cereno Scientific's size, it seems that its liquid assets are well balanced with its total liabilities. So it's very unlikely that the kr1.86b company is short on cash, but still worth keeping an eye on the balance sheet. Simply put, the fact that Cereno Scientific has more cash than debt is arguably a good indication that it can manage its debt safely. The balance sheet is clearly the area to focus on when you are analysing debt. But it is future earnings, more than anything, that will determine Cereno Scientific's ability to maintain a healthy balance sheet going forward. So if you want to see what the professionals think, you might find this free report on analyst profit forecasts to be interesting.
In the last year Cereno Scientific wasn't profitable at an EBIT level, but managed to grow its revenue by 19%, to kr69m. We usually like to see faster growth from unprofitable companies, but each to their own.
So How Risky Is Cereno Scientific?
Statistically speaking companies that lose money are riskier than those that make money. And the fact is that over the last twelve months Cereno Scientific lost money at the earnings before interest and tax (EBIT) line. And over the same period it saw negative free cash outflow of kr118m and booked a kr69m accounting loss. Given it only has net cash of kr40.2m, the company may need to raise more capital if it doesn't reach break-even soon. Overall, its balance sheet doesn't seem overly risky, at the moment, but we're always cautious until we see the positive free cash flow. When analysing debt levels, the balance sheet is the obvious place to start. However, not all investment risk resides within the balance sheet - far from it. For instance, we've identified 4 warning signs for Cereno Scientific (2 are potentially serious) you should be aware of.
Of course, if you're the type of investor who prefers buying stocks without the burden of debt, then don't hesitate to discover our exclusive list of net cash growth stocks, today.
New: AI Stock Screener & Alerts
Our new AI Stock Screener scans the market every day to uncover opportunities.
• Dividend Powerhouses (3%+ Yield)
• Undervalued Small Caps with Insider Buying
• High growth Tech and AI Companies
Or build your own from over 50 metrics.
Have feedback on this article? Concerned about the content? Get in touch with us directly. Alternatively, email editorial-team (at) simplywallst.com.
This article by Simply Wall St is general in nature. We provide commentary based on historical data and analyst forecasts only using an unbiased methodology and our articles are not intended to be financial advice. It does not constitute a recommendation to buy or sell any stock, and does not take account of your objectives, or your financial situation. We aim to bring you long-term focused analysis driven by fundamental data. Note that our analysis may not factor in the latest price-sensitive company announcements or qualitative material. Simply Wall St has no position in any stocks mentioned.
About OM:CRNO B
Cereno Scientific
A clinical stage biotechnology company, develops therapeutics to treat cardiovascular and pulmonary diseases in Sweden and internationally.
Low with worrying balance sheet.
Market Insights


Advertisement
Community Narratives
Alphabet: The Under-appreciated Compounder Hiding in Plain Sight
Fair Value US$282.83|30.2% undervalued
BL
Community Contributor
Planet Labs: At The Heart Of The Emerging New Space Boom
Fair Value US$11.31|44.5% undervalued
AN
Community Contributor
Exxon in Guyana 5 year forecast Low $135 to High $189
Fair Value US$189.00|40.8% undervalued
AG
Community Contributor