Warren Buffett famously said, 'Volatility is far from synonymous with risk.' It's only natural to consider a company's balance sheet when you examine how risky it is, since debt is often involved when a business collapses. As with many other companies TradeDoubler AB (publ) (STO:TRAD) makes use of debt. But is this debt a concern to shareholders?
What Risk Does Debt Bring?
Debt is a tool to help businesses grow, but if a business is incapable of paying off its lenders, then it exists at their mercy. If things get really bad, the lenders can take control of the business. However, a more usual (but still expensive) situation is where a company must dilute shareholders at a cheap share price simply to get debt under control. Of course, plenty of companies use debt to fund growth, without any negative consequences. The first thing to do when considering how much debt a business uses is to look at its cash and debt together.
See our latest analysis for TradeDoubler
How Much Debt Does TradeDoubler Carry?
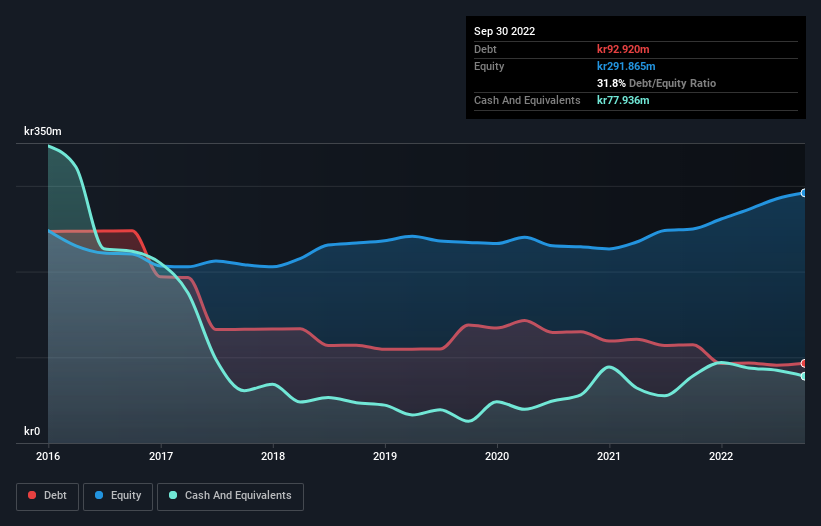
The image below, which you can click on for greater detail, shows that TradeDoubler had debt of kr92.9m at the end of September 2022, a reduction from kr114.7m over a year. However, because it has a cash reserve of kr77.9m, its net debt is less, at about kr15.0m.

A Look At TradeDoubler's Liabilities
The latest balance sheet data shows that TradeDoubler had liabilities of kr515.3m due within a year, and liabilities of kr111.3m falling due after that. On the other hand, it had cash of kr77.9m and kr378.7m worth of receivables due within a year. So its liabilities total kr170.0m more than the combination of its cash and short-term receivables.
This deficit is considerable relative to its market capitalization of kr190.3m, so it does suggest shareholders should keep an eye on TradeDoubler's use of debt. Should its lenders demand that it shore up the balance sheet, shareholders would likely face severe dilution.
We measure a company's debt load relative to its earnings power by looking at its net debt divided by its earnings before interest, tax, depreciation, and amortization (EBITDA) and by calculating how easily its earnings before interest and tax (EBIT) cover its interest expense (interest cover). This way, we consider both the absolute quantum of the debt, as well as the interest rates paid on it.
While TradeDoubler's low debt to EBITDA ratio of 0.37 suggests only modest use of debt, the fact that EBIT only covered the interest expense by 4.5 times last year does give us pause. But the interest payments are certainly sufficient to have us thinking about how affordable its debt is. It is well worth noting that TradeDoubler's EBIT shot up like bamboo after rain, gaining 66% in the last twelve months. That'll make it easier to manage its debt. The balance sheet is clearly the area to focus on when you are analysing debt. But you can't view debt in total isolation; since TradeDoubler will need earnings to service that debt. So when considering debt, it's definitely worth looking at the earnings trend. Click here for an interactive snapshot.
Finally, a company can only pay off debt with cold hard cash, not accounting profits. So we always check how much of that EBIT is translated into free cash flow. Happily for any shareholders, TradeDoubler actually produced more free cash flow than EBIT over the last three years. There's nothing better than incoming cash when it comes to staying in your lenders' good graces.
Our View
Happily, TradeDoubler's impressive conversion of EBIT to free cash flow implies it has the upper hand on its debt. But truth be told we feel its level of total liabilities does undermine this impression a bit. All these things considered, it appears that TradeDoubler can comfortably handle its current debt levels. Of course, while this leverage can enhance returns on equity, it does bring more risk, so it's worth keeping an eye on this one. The balance sheet is clearly the area to focus on when you are analysing debt. However, not all investment risk resides within the balance sheet - far from it. To that end, you should be aware of the 1 warning sign we've spotted with TradeDoubler .
Of course, if you're the type of investor who prefers buying stocks without the burden of debt, then don't hesitate to discover our exclusive list of net cash growth stocks, today.
Valuation is complex, but we're here to simplify it.
Discover if TradeDoubler might be undervalued or overvalued with our detailed analysis, featuring fair value estimates, potential risks, dividends, insider trades, and its financial condition.
Access Free AnalysisHave feedback on this article? Concerned about the content? Get in touch with us directly. Alternatively, email editorial-team (at) simplywallst.com.
This article by Simply Wall St is general in nature. We provide commentary based on historical data and analyst forecasts only using an unbiased methodology and our articles are not intended to be financial advice. It does not constitute a recommendation to buy or sell any stock, and does not take account of your objectives, or your financial situation. We aim to bring you long-term focused analysis driven by fundamental data. Note that our analysis may not factor in the latest price-sensitive company announcements or qualitative material. Simply Wall St has no position in any stocks mentioned.
About OM:TRAD
TradeDoubler
Provides performance marketing and technology solutions for publishers and advertisers worldwide.
Excellent balance sheet with reasonable growth potential.
Market Insights
Community Narratives


