
Advertisement
Howard Marks put it nicely when he said that, rather than worrying about share price volatility, 'The possibility of permanent loss is the risk I worry about... and every practical investor I know worries about.' When we think about how risky a company is, we always like to look at its use of debt, since debt overload can lead to ruin. As with many other companies Stillfront Group AB (publ) (STO:SF) makes use of debt. But is this debt a concern to shareholders?
What Risk Does Debt Bring?
Generally speaking, debt only becomes a real problem when a company can't easily pay it off, either by raising capital or with its own cash flow. Ultimately, if the company can't fulfill its legal obligations to repay debt, shareholders could walk away with nothing. However, a more frequent (but still costly) occurrence is where a company must issue shares at bargain-basement prices, permanently diluting shareholders, just to shore up its balance sheet. Having said that, the most common situation is where a company manages its debt reasonably well - and to its own advantage. When we think about a company's use of debt, we first look at cash and debt together.
See our latest analysis for Stillfront Group
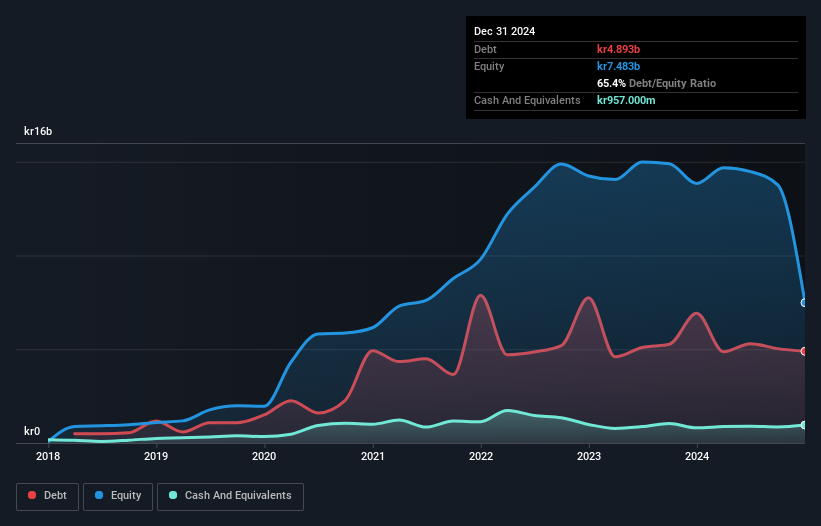
What Is Stillfront Group's Net Debt?
The image below, which you can click on for greater detail, shows that Stillfront Group had debt of kr4.89b at the end of December 2024, a reduction from kr6.92b over a year. On the flip side, it has kr957.0m in cash leading to net debt of about kr3.94b.
How Healthy Is Stillfront Group's Balance Sheet?
Zooming in on the latest balance sheet data, we can see that Stillfront Group had liabilities of kr1.86b due within 12 months and liabilities of kr7.02b due beyond that. On the other hand, it had cash of kr957.0m and kr811.0m worth of receivables due within a year. So its liabilities total kr7.12b more than the combination of its cash and short-term receivables.
The deficiency here weighs heavily on the kr2.71b company itself, as if a child were struggling under the weight of an enormous back-pack full of books, his sports gear, and a trumpet. So we definitely think shareholders need to watch this one closely. At the end of the day, Stillfront Group would probably need a major re-capitalization if its creditors were to demand repayment.
We use two main ratios to inform us about debt levels relative to earnings. The first is net debt divided by earnings before interest, tax, depreciation, and amortization (EBITDA), while the second is how many times its earnings before interest and tax (EBIT) covers its interest expense (or its interest cover, for short). Thus we consider debt relative to earnings both with and without depreciation and amortization expenses.
While Stillfront Group's debt to EBITDA ratio (2.7) suggests that it uses some debt, its interest cover is very weak, at 1.6, suggesting high leverage. It seems that the business incurs large depreciation and amortisation charges, so maybe its debt load is heavier than it would first appear, since EBITDA is arguably a generous measure of earnings. It seems clear that the cost of borrowing money is negatively impacting returns for shareholders, of late. Even more troubling is the fact that Stillfront Group actually let its EBIT decrease by 4.4% over the last year. If that earnings trend continues the company will face an uphill battle to pay off its debt. There's no doubt that we learn most about debt from the balance sheet. But it is future earnings, more than anything, that will determine Stillfront Group's ability to maintain a healthy balance sheet going forward. So if you want to see what the professionals think, you might find this free report on analyst profit forecasts to be interesting.
Finally, a business needs free cash flow to pay off debt; accounting profits just don't cut it. So we clearly need to look at whether that EBIT is leading to corresponding free cash flow. Over the last three years, Stillfront Group actually produced more free cash flow than EBIT. There's nothing better than incoming cash when it comes to staying in your lenders' good graces.
Our View
To be frank both Stillfront Group's interest cover and its track record of staying on top of its total liabilities make us rather uncomfortable with its debt levels. But at least it's pretty decent at converting EBIT to free cash flow; that's encouraging. Looking at the bigger picture, it seems clear to us that Stillfront Group's use of debt is creating risks for the company. If everything goes well that may pay off but the downside of this debt is a greater risk of permanent losses. When analysing debt levels, the balance sheet is the obvious place to start. However, not all investment risk resides within the balance sheet - far from it. To that end, you should be aware of the 1 warning sign we've spotted with Stillfront Group .
When all is said and done, sometimes its easier to focus on companies that don't even need debt. Readers can access a list of growth stocks with zero net debt 100% free, right now.
New: Manage All Your Stock Portfolios in One Place
We've created the ultimate portfolio companion for stock investors, and it's free.
• Connect an unlimited number of Portfolios and see your total in one currency
• Be alerted to new Warning Signs or Risks via email or mobile
• Track the Fair Value of your stocks
Have feedback on this article? Concerned about the content? Get in touch with us directly. Alternatively, email editorial-team (at) simplywallst.com.
This article by Simply Wall St is general in nature. We provide commentary based on historical data and analyst forecasts only using an unbiased methodology and our articles are not intended to be financial advice. It does not constitute a recommendation to buy or sell any stock, and does not take account of your objectives, or your financial situation. We aim to bring you long-term focused analysis driven by fundamental data. Note that our analysis may not factor in the latest price-sensitive company announcements or qualitative material. Simply Wall St has no position in any stocks mentioned.
About OM:SF
Stillfront Group
Designs, develops, markets, publishes, and sells digital games in Europe, North America, the Middle East and North Africa, and the Asia-Pacific.
Undervalued with moderate growth potential.
Similar Companies
Market Insights

Advertisement
Weekly Picks
TH


TheWallstreetKing on MicroVision ·
MicroVision will explode future revenue by 380.37% with a vision towards success
Fair Value:US$6098.4% undervalued
109 followersusers have followed this narrative
10 commentsusers have commented on this narrative
21 likesusers have liked this narrative
TI


TibiT on Canadian National Railway ·
The Indispensable Artery for a New North American Economy
Fair Value:CA$132.870.7% overvalued
20 followersusers have followed this narrative
4 commentsusers have commented on this narrative
3 likesusers have liked this narrative
RE

RecMag on Agfa-Gevaert ·
Agfa-Gevaert is a digital and materials turnaround opportunity, with growth potential in ZIRFON, but carrying legacy risks.
Fair Value:€5.3988.2% undervalued
19 followersusers have followed this narrative
0 commentsusers have commented on this narrative
3 likesusers have liked this narrative
Recently Updated Narratives
NI

niteco on Texas Instruments ·
Engineered for Stability. Positioned for Growth.
Fair Value:US$314.4446.5% undervalued
1 followerusers have followed this narrative
0 commentsusers have commented on this narrative
0 likesusers have liked this narrative
BE


Bejgal on MINISO Group Holding ·
MINISO's fair value is projected at 26.69 with an anticipated PE ratio shift of 20x
Fair Value:US$28.1829.5% undervalued
46 followersusers have followed this narrative
3 commentsusers have commented on this narrative
0 likesusers have liked this narrative
BE

Bejgal on Fiverr International ·
Fiverr International will transform the freelance industry with AI-powered growth
Fair Value:US$36.8143.1% undervalued
79 followersusers have followed this narrative
7 commentsusers have commented on this narrative
1 likeusers have liked this narrative
Popular Narratives
TH
TheWallstreetKing on MicroVision ·
MicroVision will explode future revenue by 380.37% with a vision towards success
Fair Value:US$6098.4% undervalued
109 followersusers have followed this narrative
10 commentsusers have commented on this narrative
21 likesusers have liked this narrative
AN


AnalystConsensusTarget on NVIDIA ·
NVDA: Expanding AI Demand Will Drive Major Data Center Investments Through 2026
Fair Value:US$250.3929.3% undervalued
939 followersusers have followed this narrative
6 commentsusers have commented on this narrative
24 likesusers have liked this narrative
OS


oscargarcia on Alphabet ·
The company that turned a verb into a global necessity and basically runs the modern internet, digital ads, smartphones, maps, and AI.
Fair Value:US$3405.8% undervalued
145 followersusers have followed this narrative
6 commentsusers have commented on this narrative
18 likesusers have liked this narrative