
Advertisement

Today we are going to look at THQ Nordic AB (publ) (STO:THQN B) to see whether it might be an attractive investment prospect. To be precise, we'll consider its Return On Capital Employed (ROCE), as that will inform our view of the quality of the business.
First of all, we'll work out how to calculate ROCE. Next, we'll compare it to others in its industry. Then we'll determine how its current liabilities are affecting its ROCE.
Understanding Return On Capital Employed (ROCE)
ROCE is a metric for evaluating how much pre-tax income (in percentage terms) a company earns on the capital invested in its business. All else being equal, a better business will have a higher ROCE. Overall, it is a valuable metric that has its flaws. Renowned investment researcher Michael Mauboussin has suggested that a high ROCE can indicate that 'one dollar invested in the company generates value of more than one dollar'.
How Do You Calculate Return On Capital Employed?
Analysts use this formula to calculate return on capital employed:
Return on Capital Employed = Earnings Before Interest and Tax (EBIT) ÷ (Total Assets - Current Liabilities)
Or for THQ Nordic:
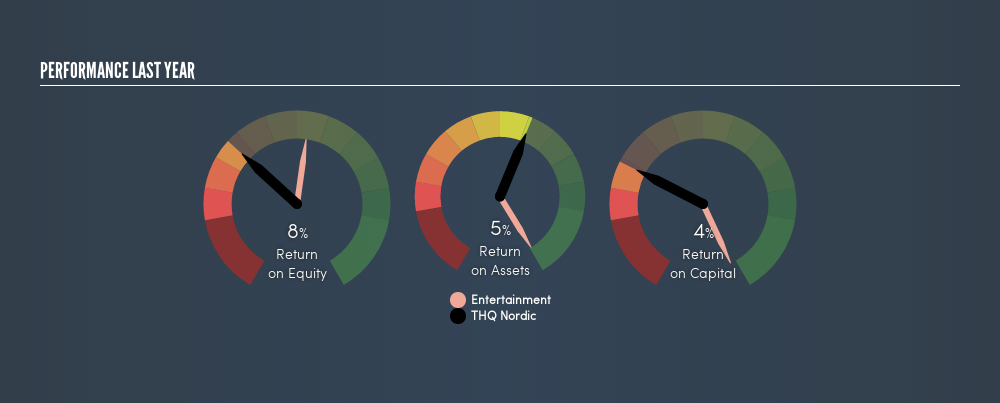
0.045 = kr185m ÷ (kr6.4b - kr2.3b) (Based on the trailing twelve months to December 2018.)
So, THQ Nordic has an ROCE of 4.5%.
Want to participate in a short research study? Help shape the future of investing tools and you could win a $250 gift card!
View our latest analysis for THQ Nordic
Does THQ Nordic Have A Good ROCE?
ROCE can be useful when making comparisons, such as between similar companies. In this analysis, THQ Nordic's ROCE appears meaningfully below the 20% average reported by the Entertainment industry. This performance is not ideal, as it suggests the company may not be deploying its capital as effectively as some competitors. Setting aside the industry comparison for now, THQ Nordic's ROCE is mediocre in absolute terms, considering the risk of investing in stocks versus the safety of a bank account. It is possible that there are more rewarding investments out there.
THQ Nordic's current ROCE of 4.5% is lower than its ROCE in the past, which was 66%, 3 years ago. So investors might consider if it has had issues recently.
When considering ROCE, bear in mind that it reflects the past and does not necessarily predict the future. Companies in cyclical industries can be difficult to understand using ROCE, as returns typically look high during boom times, and low during busts. This is because ROCE only looks at one year, instead of considering returns across a whole cycle. Future performance is what matters, and you can see analyst predictions in our free report on analyst forecasts for the company.
What Are Current Liabilities, And How Do They Affect THQ Nordic's ROCE?
Liabilities, such as supplier bills and bank overdrafts, are referred to as current liabilities if they need to be paid within 12 months. The ROCE equation subtracts current liabilities from capital employed, so a company with a lot of current liabilities appears to have less capital employed, and a higher ROCE than otherwise. To counteract this, we check if a company has high current liabilities, relative to its total assets.
THQ Nordic has total liabilities of kr2.3b and total assets of kr6.4b. As a result, its current liabilities are equal to approximately 35% of its total assets. THQ Nordic's ROCE is improved somewhat by its moderate amount of current liabilities.
What We Can Learn From THQ Nordic's ROCE
With this level of liabilities and a mediocre ROCE, there are potentially better investments out there. Of course, you might also be able to find a better stock than THQ Nordic. So you may wish to see this free collection of other companies that have grown earnings strongly.
I will like THQ Nordic better if I see some big insider buys. While we wait, check out this free list of growing companies with considerable, recent, insider buying.
We aim to bring you long-term focused research analysis driven by fundamental data. Note that our analysis may not factor in the latest price-sensitive company announcements or qualitative material.
If you spot an error that warrants correction, please contact the editor at editorial-team@simplywallst.com. This article by Simply Wall St is general in nature. It does not constitute a recommendation to buy or sell any stock, and does not take account of your objectives, or your financial situation. Simply Wall St has no position in the stocks mentioned. Thank you for reading.
About OM:EMBRAC B
Embracer Group
Develops and publishes PC, console, mobile, VR, and board games for the games market worldwide.
Flawless balance sheet and undervalued.
Similar Companies
Market Insights


Advertisement
Community Narratives
For the Emperor: Why Games Workshop Could Be a Star Investment
Fair Value UK£160.00|0.4% overvalued
RO
Community Contributor
Securitas will boost margins with AI and tech-driven services
Fair Value SEK 260.91|44.5% undervalued
UN
Community Contributor
A Leader in EV Charging with Growth Potential
Fair Value €27.00|17.8% undervalued
TI
Community Contributor