Nexam Chemical Holding (STO:NEXAM) Has Debt But No Earnings; Should You Worry?


Warren Buffett famously said, 'Volatility is far from synonymous with risk.' So it might be obvious that you need to consider debt, when you think about how risky any given stock is, because too much debt can sink a company. As with many other companies Nexam Chemical Holding AB (publ) (STO:NEXAM) makes use of debt. But should shareholders be worried about its use of debt?
When Is Debt Dangerous?
Debt is a tool to help businesses grow, but if a business is incapable of paying off its lenders, then it exists at their mercy. If things get really bad, the lenders can take control of the business. While that is not too common, we often do see indebted companies permanently diluting shareholders because lenders force them to raise capital at a distressed price. Of course, debt can be an important tool in businesses, particularly capital heavy businesses. The first step when considering a company's debt levels is to consider its cash and debt together.
Check out our latest analysis for Nexam Chemical Holding
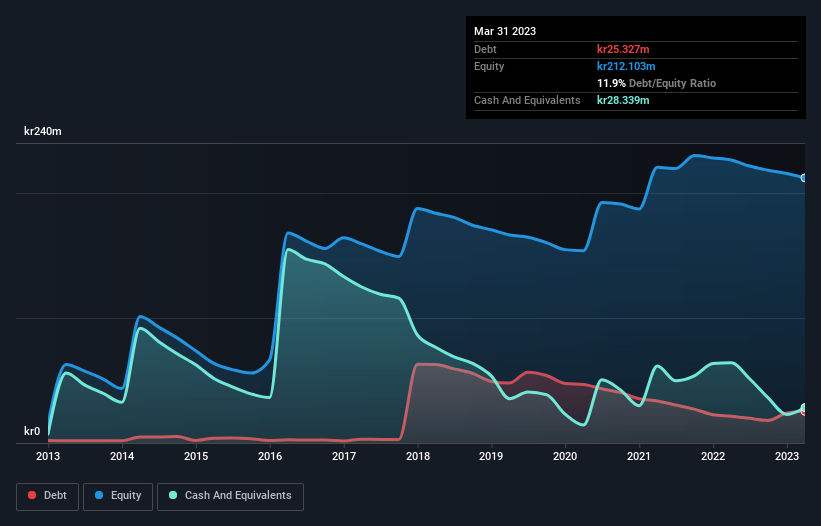
What Is Nexam Chemical Holding's Net Debt?
As you can see below, at the end of March 2023, Nexam Chemical Holding had kr25.3m of debt, up from kr21.5m a year ago. Click the image for more detail. However, its balance sheet shows it holds kr28.3m in cash, so it actually has kr3.01m net cash.
How Healthy Is Nexam Chemical Holding's Balance Sheet?
We can see from the most recent balance sheet that Nexam Chemical Holding had liabilities of kr47.1m falling due within a year, and liabilities of kr24.9m due beyond that. Offsetting these obligations, it had cash of kr28.3m as well as receivables valued at kr43.7m due within 12 months. So its total liabilities are just about perfectly matched by its shorter-term, liquid assets.
This state of affairs indicates that Nexam Chemical Holding's balance sheet looks quite solid, as its total liabilities are just about equal to its liquid assets. So it's very unlikely that the kr339.0m company is short on cash, but still worth keeping an eye on the balance sheet. Succinctly put, Nexam Chemical Holding boasts net cash, so it's fair to say it does not have a heavy debt load! There's no doubt that we learn most about debt from the balance sheet. But it is future earnings, more than anything, that will determine Nexam Chemical Holding's ability to maintain a healthy balance sheet going forward. So if you want to see what the professionals think, you might find this free report on analyst profit forecasts to be interesting.
Over 12 months, Nexam Chemical Holding saw its revenue hold pretty steady, and it did not report positive earnings before interest and tax. While that hardly impresses, its not too bad either.
So How Risky Is Nexam Chemical Holding?
By their very nature companies that are losing money are more risky than those with a long history of profitability. And in the last year Nexam Chemical Holding had an earnings before interest and tax (EBIT) loss, truth be told. And over the same period it saw negative free cash outflow of kr39m and booked a kr15m accounting loss. Given it only has net cash of kr3.01m, the company may need to raise more capital if it doesn't reach break-even soon. Even though its balance sheet seems sufficiently liquid, debt always makes us a little nervous if a company doesn't produce free cash flow regularly. When analysing debt levels, the balance sheet is the obvious place to start. However, not all investment risk resides within the balance sheet - far from it. Case in point: We've spotted 2 warning signs for Nexam Chemical Holding you should be aware of.
At the end of the day, it's often better to focus on companies that are free from net debt. You can access our special list of such companies (all with a track record of profit growth). It's free.
If you're looking to trade Nexam Chemical Holding, open an account with the lowest-cost platform trusted by professionals, Interactive Brokers.
With clients in over 200 countries and territories, and access to 160 markets, IBKR lets you trade stocks, options, futures, forex, bonds and funds from a single integrated account.
Enjoy no hidden fees, no account minimums, and FX conversion rates as low as 0.03%, far better than what most brokers offer.
Sponsored ContentValuation is complex, but we're here to simplify it.
Discover if Nexam Chemical Holding might be undervalued or overvalued with our detailed analysis, featuring fair value estimates, potential risks, dividends, insider trades, and its financial condition.
Access Free AnalysisHave feedback on this article? Concerned about the content? Get in touch with us directly. Alternatively, email editorial-team (at) simplywallst.com.
This article by Simply Wall St is general in nature. We provide commentary based on historical data and analyst forecasts only using an unbiased methodology and our articles are not intended to be financial advice. It does not constitute a recommendation to buy or sell any stock, and does not take account of your objectives, or your financial situation. We aim to bring you long-term focused analysis driven by fundamental data. Note that our analysis may not factor in the latest price-sensitive company announcements or qualitative material. Simply Wall St has no position in any stocks mentioned.
About OM:NEXAM
Nexam Chemical Holding
Develops solutions that enhance properties and performance of plastics in Sweden, Europe, and internationally.
Reasonable growth potential with adequate balance sheet.
Market Insights

Community Narratives

