A Piece Of The Puzzle Missing From Nexam Chemical Holding AB (publ)'s (STO:NEXAM) 26% Share Price Climb

Nexam Chemical Holding AB (publ) (STO:NEXAM) shareholders have had their patience rewarded with a 26% share price jump in the last month. Longer-term shareholders would be thankful for the recovery in the share price since it's now virtually flat for the year after the recent bounce.
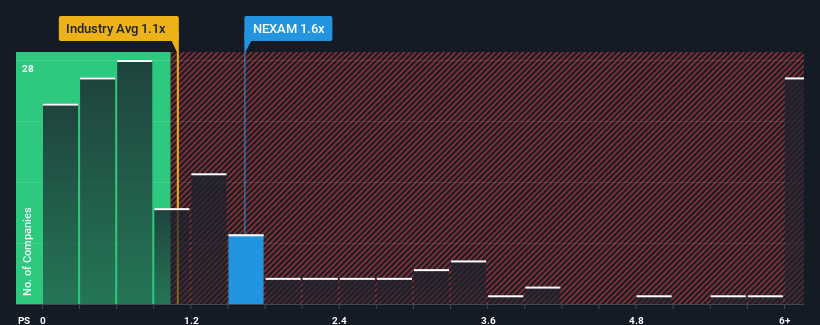
Although its price has surged higher, Nexam Chemical Holding may still be sending bullish signals at the moment with its price-to-sales (or "P/S") ratio of 1.6x, since almost half of all companies in the Chemicals industry in Sweden have P/S ratios greater than 2.8x and even P/S higher than 10x are not unusual. Although, it's not wise to just take the P/S at face value as there may be an explanation why it's limited.
View our latest analysis for Nexam Chemical Holding

How Has Nexam Chemical Holding Performed Recently?
Nexam Chemical Holding has been struggling lately as its revenue has declined faster than most other companies. Perhaps the market isn't expecting future revenue performance to improve, which has kept the P/S suppressed. So while you could say the stock is cheap, investors will be looking for improvement before they see it as good value. Or at the very least, you'd be hoping the revenue slide doesn't get any worse if your plan is to pick up some stock while it's out of favour.
If you'd like to see what analysts are forecasting going forward, you should check out our free report on Nexam Chemical Holding.What Are Revenue Growth Metrics Telling Us About The Low P/S?
There's an inherent assumption that a company should underperform the industry for P/S ratios like Nexam Chemical Holding's to be considered reasonable.
Taking a look back first, the company's revenue growth last year wasn't something to get excited about as it posted a disappointing decline of 13%. Regardless, revenue has managed to lift by a handy 8.3% in aggregate from three years ago, thanks to the earlier period of growth. Although it's been a bumpy ride, it's still fair to say the revenue growth recently has been mostly respectable for the company.
Shifting to the future, estimates from the sole analyst covering the company suggest revenue should grow by 19% over the next year. That's shaping up to be materially higher than the 4.2% growth forecast for the broader industry.
With this in consideration, we find it intriguing that Nexam Chemical Holding's P/S sits behind most of its industry peers. It looks like most investors are not convinced at all that the company can achieve future growth expectations.
What We Can Learn From Nexam Chemical Holding's P/S?
The latest share price surge wasn't enough to lift Nexam Chemical Holding's P/S close to the industry median. Typically, we'd caution against reading too much into price-to-sales ratios when settling on investment decisions, though it can reveal plenty about what other market participants think about the company.
To us, it seems Nexam Chemical Holding currently trades on a significantly depressed P/S given its forecasted revenue growth is higher than the rest of its industry. The reason for this depressed P/S could potentially be found in the risks the market is pricing in. While the possibility of the share price plunging seems unlikely due to the high growth forecasted for the company, the market does appear to have some hesitation.
It is also worth noting that we have found 2 warning signs for Nexam Chemical Holding that you need to take into consideration.
If you're unsure about the strength of Nexam Chemical Holding's business, why not explore our interactive list of stocks with solid business fundamentals for some other companies you may have missed.
Valuation is complex, but we're here to simplify it.
Discover if Nexam Chemical Holding might be undervalued or overvalued with our detailed analysis, featuring fair value estimates, potential risks, dividends, insider trades, and its financial condition.
Access Free AnalysisHave feedback on this article? Concerned about the content? Get in touch with us directly. Alternatively, email editorial-team (at) simplywallst.com.
This article by Simply Wall St is general in nature. We provide commentary based on historical data and analyst forecasts only using an unbiased methodology and our articles are not intended to be financial advice. It does not constitute a recommendation to buy or sell any stock, and does not take account of your objectives, or your financial situation. We aim to bring you long-term focused analysis driven by fundamental data. Note that our analysis may not factor in the latest price-sensitive company announcements or qualitative material. Simply Wall St has no position in any stocks mentioned.
Have feedback on this article? Concerned about the content? Get in touch with us directly. Alternatively, email editorial-team@simplywallst.com
About OM:NEXAM
Nexam Chemical Holding
Develops solutions that enhance properties and performance of plastics in Sweden, Europe, and internationally.
Reasonable growth potential with adequate balance sheet.
Market Insights
Community Narratives


