- Sweden
- /
- Medical Equipment
- /
- OM:SUS
Do Its Financials Have Any Role To Play In Driving Surgical Science Sweden AB (publ)'s (STO:SUS) Stock Up Recently?


Surgical Science Sweden's (STO:SUS) stock is up by a considerable 9.6% over the past week. We wonder if and what role the company's financials play in that price change as a company's long-term fundamentals usually dictate market outcomes. Specifically, we decided to study Surgical Science Sweden's ROE in this article.
Return on equity or ROE is a key measure used to assess how efficiently a company's management is utilizing the company's capital. In other words, it is a profitability ratio which measures the rate of return on the capital provided by the company's shareholders.
See our latest analysis for Surgical Science Sweden
How Is ROE Calculated?
ROE can be calculated by using the formula:
Return on Equity = Net Profit (from continuing operations) ÷ Shareholders' Equity
So, based on the above formula, the ROE for Surgical Science Sweden is:
4.3% = kr198m ÷ kr4.6b (Based on the trailing twelve months to June 2024).
The 'return' is the yearly profit. Another way to think of that is that for every SEK1 worth of equity, the company was able to earn SEK0.04 in profit.
What Is The Relationship Between ROE And Earnings Growth?
We have already established that ROE serves as an efficient profit-generating gauge for a company's future earnings. Based on how much of its profits the company chooses to reinvest or "retain", we are then able to evaluate a company's future ability to generate profits. Generally speaking, other things being equal, firms with a high return on equity and profit retention, have a higher growth rate than firms that don’t share these attributes.
A Side By Side comparison of Surgical Science Sweden's Earnings Growth And 4.3% ROE
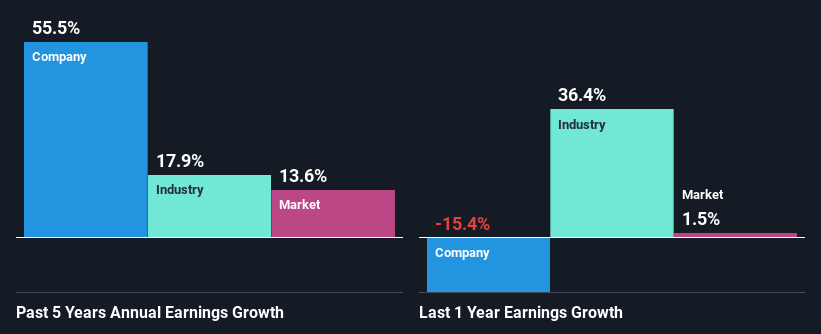
At first glance, Surgical Science Sweden's ROE doesn't look very promising. We then compared the company's ROE to the broader industry and were disappointed to see that the ROE is lower than the industry average of 7.3%. However, we we're pleasantly surprised to see that Surgical Science Sweden grew its net income at a significant rate of 56% in the last five years. Therefore, there could be other reasons behind this growth. For instance, the company has a low payout ratio or is being managed efficiently.
We then compared Surgical Science Sweden's net income growth with the industry and we're pleased to see that the company's growth figure is higher when compared with the industry which has a growth rate of 18% in the same 5-year period.
The basis for attaching value to a company is, to a great extent, tied to its earnings growth. What investors need to determine next is if the expected earnings growth, or the lack of it, is already built into the share price. This then helps them determine if the stock is placed for a bright or bleak future. If you're wondering about Surgical Science Sweden's's valuation, check out this gauge of its price-to-earnings ratio, as compared to its industry.
Is Surgical Science Sweden Using Its Retained Earnings Effectively?
Given that Surgical Science Sweden doesn't pay any regular dividends to its shareholders, we infer that the company has been reinvesting all of its profits to grow its business.
Summary
On the whole, we do feel that Surgical Science Sweden has some positive attributes. Despite its low rate of return, the fact that the company reinvests a very high portion of its profits into its business, no doubt contributed to its high earnings growth. With that said, the latest industry analyst forecasts reveal that the company's earnings growth is expected to slow down. Are these analysts expectations based on the broad expectations for the industry, or on the company's fundamentals? Click here to be taken to our analyst's forecasts page for the company.
New: Manage All Your Stock Portfolios in One Place
We've created the ultimate portfolio companion for stock investors, and it's free.
• Connect an unlimited number of Portfolios and see your total in one currency
• Be alerted to new Warning Signs or Risks via email or mobile
• Track the Fair Value of your stocks
Have feedback on this article? Concerned about the content? Get in touch with us directly. Alternatively, email editorial-team (at) simplywallst.com.
This article by Simply Wall St is general in nature. We provide commentary based on historical data and analyst forecasts only using an unbiased methodology and our articles are not intended to be financial advice. It does not constitute a recommendation to buy or sell any stock, and does not take account of your objectives, or your financial situation. We aim to bring you long-term focused analysis driven by fundamental data. Note that our analysis may not factor in the latest price-sensitive company announcements or qualitative material. Simply Wall St has no position in any stocks mentioned.
About OM:SUS
Surgical Science Sweden
Develops and markets virtual reality simulators for evidence-based medical training in Europe, North and South America, Asia, and internationally.
Flawless balance sheet with reasonable growth potential.
Similar Companies
Market Insights

Community Narratives


