
Advertisement

Key Insights
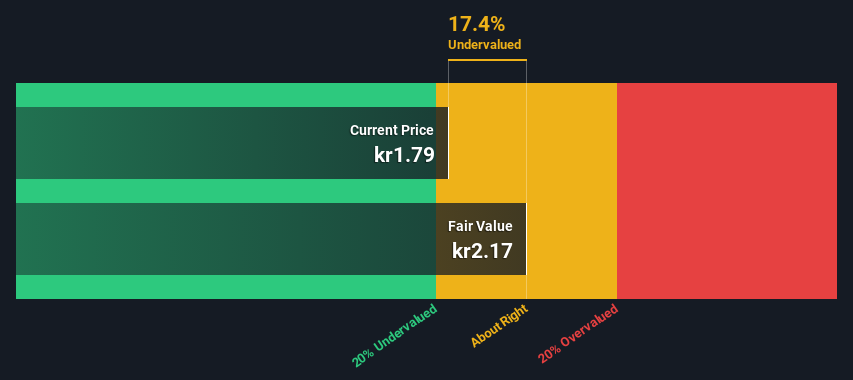
- ScandiDos' estimated fair value is kr2.17 based on 2 Stage Free Cash Flow to Equity
- Current share price of kr1.79 suggests ScandiDos is potentially trading close to its fair value
- Industry average discount to fair value of 31% suggests ScandiDos' peers are currently trading at a higher discount
In this article we are going to estimate the intrinsic value of ScandiDos AB (publ) (STO:SDOS) by projecting its future cash flows and then discounting them to today's value. We will take advantage of the Discounted Cash Flow (DCF) model for this purpose. Models like these may appear beyond the comprehension of a lay person, but they're fairly easy to follow.
We would caution that there are many ways of valuing a company and, like the DCF, each technique has advantages and disadvantages in certain scenarios. Anyone interested in learning a bit more about intrinsic value should have a read of the Simply Wall St analysis model.
View our latest analysis for ScandiDos
Is ScandiDos Fairly Valued?
We use what is known as a 2-stage model, which simply means we have two different periods of growth rates for the company's cash flows. Generally the first stage is higher growth, and the second stage is a lower growth phase. To start off with, we need to estimate the next ten years of cash flows. Where possible we use analyst estimates, but when these aren't available we extrapolate the previous free cash flow (FCF) from the last estimate or reported value. We assume companies with shrinking free cash flow will slow their rate of shrinkage, and that companies with growing free cash flow will see their growth rate slow, over this period. We do this to reflect that growth tends to slow more in the early years than it does in later years.
A DCF is all about the idea that a dollar in the future is less valuable than a dollar today, so we discount the value of these future cash flows to their estimated value in today's dollars:
10-year free cash flow (FCF) estimate
| 2024 | 2025 | 2026 | 2027 | 2028 | 2029 | 2030 | 2031 | 2032 | 2033 | |
| Levered FCF (SEK, Millions) | kr8.00m | kr4.00m | kr6.00m | kr5.31m | kr4.90m | kr4.64m | kr4.48m | kr4.37m | kr4.31m | kr4.28m |
| Growth Rate Estimate Source | Analyst x1 | Analyst x1 | Analyst x1 | Est @ -11.47% | Est @ -7.83% | Est @ -5.28% | Est @ -3.50% | Est @ -2.25% | Est @ -1.37% | Est @ -0.76% |
| Present Value (SEK, Millions) Discounted @ 5.1% | kr7.6 | kr3.6 | kr5.2 | kr4.4 | kr3.8 | kr3.4 | kr3.2 | kr2.9 | kr2.8 | kr2.6 |
("Est" = FCF growth rate estimated by Simply Wall St)
Present Value of 10-year Cash Flow (PVCF) = kr39m
We now need to calculate the Terminal Value, which accounts for all the future cash flows after this ten year period. The Gordon Growth formula is used to calculate Terminal Value at a future annual growth rate equal to the 5-year average of the 10-year government bond yield of 0.7%. We discount the terminal cash flows to today's value at a cost of equity of 5.1%.
Terminal Value (TV)= FCF2033 × (1 + g) ÷ (r – g) = kr4.3m× (1 + 0.7%) ÷ (5.1%– 0.7%) = kr97m
Present Value of Terminal Value (PVTV)= TV / (1 + r)10= kr97m÷ ( 1 + 5.1%)10= kr59m
The total value is the sum of cash flows for the next ten years plus the discounted terminal value, which results in the Total Equity Value, which in this case is kr99m. The last step is to then divide the equity value by the number of shares outstanding. Compared to the current share price of kr1.8, the company appears about fair value at a 17% discount to where the stock price trades currently. The assumptions in any calculation have a big impact on the valuation, so it is better to view this as a rough estimate, not precise down to the last cent.
Important Assumptions
We would point out that the most important inputs to a discounted cash flow are the discount rate and of course the actual cash flows. You don't have to agree with these inputs, I recommend redoing the calculations yourself and playing with them. The DCF also does not consider the possible cyclicality of an industry, or a company's future capital requirements, so it does not give a full picture of a company's potential performance. Given that we are looking at ScandiDos as potential shareholders, the cost of equity is used as the discount rate, rather than the cost of capital (or weighted average cost of capital, WACC) which accounts for debt. In this calculation we've used 5.1%, which is based on a levered beta of 0.885. Beta is a measure of a stock's volatility, compared to the market as a whole. We get our beta from the industry average beta of globally comparable companies, with an imposed limit between 0.8 and 2.0, which is a reasonable range for a stable business.
SWOT Analysis for ScandiDos
Strength
- Currently debt free.
Weakness
- No major weaknesses identified for SDOS.
Opportunity
- Expected to breakeven next year.
- Good value based on P/S ratio and estimated fair value.
Threat
- Has less than 3 years of cash runway based on current free cash flow.
Next Steps:
Although the valuation of a company is important, it shouldn't be the only metric you look at when researching a company. The DCF model is not a perfect stock valuation tool. Rather it should be seen as a guide to "what assumptions need to be true for this stock to be under/overvalued?" For example, changes in the company's cost of equity or the risk free rate can significantly impact the valuation. For ScandiDos, we've compiled three pertinent factors you should consider:
- Risks: As an example, we've found 2 warning signs for ScandiDos (1 is a bit concerning!) that you need to consider before investing here.
- Future Earnings: How does SDOS's growth rate compare to its peers and the wider market? Dig deeper into the analyst consensus number for the upcoming years by interacting with our free analyst growth expectation chart.
- Other Solid Businesses: Low debt, high returns on equity and good past performance are fundamental to a strong business. Why not explore our interactive list of stocks with solid business fundamentals to see if there are other companies you may not have considered!
PS. The Simply Wall St app conducts a discounted cash flow valuation for every stock on the OM every day. If you want to find the calculation for other stocks just search here.
New: Manage All Your Stock Portfolios in One Place
We've created the ultimate portfolio companion for stock investors, and it's free.
• Connect an unlimited number of Portfolios and see your total in one currency
• Be alerted to new Warning Signs or Risks via email or mobile
• Track the Fair Value of your stocks
Have feedback on this article? Concerned about the content? Get in touch with us directly. Alternatively, email editorial-team (at) simplywallst.com.
This article by Simply Wall St is general in nature. We provide commentary based on historical data and analyst forecasts only using an unbiased methodology and our articles are not intended to be financial advice. It does not constitute a recommendation to buy or sell any stock, and does not take account of your objectives, or your financial situation. We aim to bring you long-term focused analysis driven by fundamental data. Note that our analysis may not factor in the latest price-sensitive company announcements or qualitative material. Simply Wall St has no position in any stocks mentioned.
About OM:SDOS
ScandiDos
Engages in the provision of measurement systems and software designed for the QA and validation of new dynamic and modulated treatments implemented in clinics worldwide.
Excellent balance sheet slight.
Market Insights

Advertisement
Community Narratives

BMW cruising ahead with new EVs and premium models to boost revenue 5%
Fair Value €135.07|44.5% undervalued
UN
Community Contributor
EU#2 - From Humble Beginnings to Global Powerhouse
Fair Value DKK 851.04|46.1% undervalued
TO
Community Contributor