- Sweden
- /
- Medical Equipment
- /
- OM:OSSD
OssDsign AB (publ)'s (STO:OSSD) Share Price Matching Investor Opinion
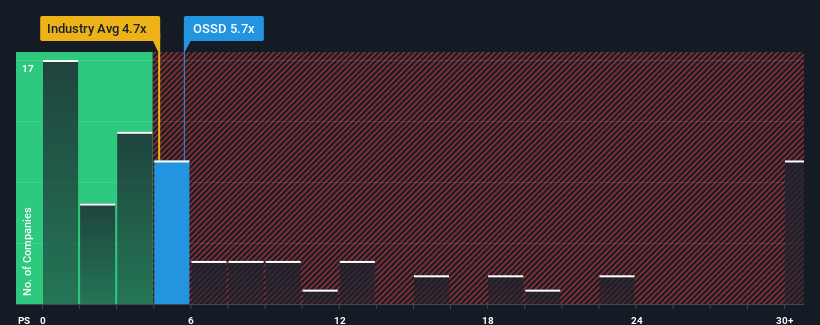
OssDsign AB (publ)'s (STO:OSSD) price-to-sales (or "P/S") ratio of 5.7x might make it look like a sell right now compared to the Medical Equipment industry in Sweden, where around half of the companies have P/S ratios below 4.7x and even P/S below 1.9x are quite common. However, the P/S might be high for a reason and it requires further investigation to determine if it's justified.
See our latest analysis for OssDsign

What Does OssDsign's Recent Performance Look Like?
With revenue growth that's superior to most other companies of late, OssDsign has been doing relatively well. It seems the market expects this form will continue into the future, hence the elevated P/S ratio. If not, then existing shareholders might be a little nervous about the viability of the share price.
If you'd like to see what analysts are forecasting going forward, you should check out our free report on OssDsign.What Are Revenue Growth Metrics Telling Us About The High P/S?
There's an inherent assumption that a company should outperform the industry for P/S ratios like OssDsign's to be considered reasonable.
If we review the last year of revenue growth, the company posted a terrific increase of 49%. The latest three year period has also seen an incredible overall rise in revenue, aided by its incredible short-term performance. So we can start by confirming that the company has done a tremendous job of growing revenue over that time.
Turning to the outlook, the next three years should generate growth of 28% each year as estimated by the four analysts watching the company. With the industry only predicted to deliver 16% each year, the company is positioned for a stronger revenue result.
With this information, we can see why OssDsign is trading at such a high P/S compared to the industry. Apparently shareholders aren't keen to offload something that is potentially eyeing a more prosperous future.
What Does OssDsign's P/S Mean For Investors?
It's argued the price-to-sales ratio is an inferior measure of value within certain industries, but it can be a powerful business sentiment indicator.
As we suspected, our examination of OssDsign's analyst forecasts revealed that its superior revenue outlook is contributing to its high P/S. It appears that shareholders are confident in the company's future revenues, which is propping up the P/S. Unless the analysts have really missed the mark, these strong revenue forecasts should keep the share price buoyant.
Plus, you should also learn about these 2 warning signs we've spotted with OssDsign.
If these risks are making you reconsider your opinion on OssDsign, explore our interactive list of high quality stocks to get an idea of what else is out there.
New: AI Stock Screener & Alerts
Our new AI Stock Screener scans the market every day to uncover opportunities.
• Dividend Powerhouses (3%+ Yield)
• Undervalued Small Caps with Insider Buying
• High growth Tech and AI Companies
Or build your own from over 50 metrics.
Have feedback on this article? Concerned about the content? Get in touch with us directly. Alternatively, email editorial-team (at) simplywallst.com.
This article by Simply Wall St is general in nature. We provide commentary based on historical data and analyst forecasts only using an unbiased methodology and our articles are not intended to be financial advice. It does not constitute a recommendation to buy or sell any stock, and does not take account of your objectives, or your financial situation. We aim to bring you long-term focused analysis driven by fundamental data. Note that our analysis may not factor in the latest price-sensitive company announcements or qualitative material. Simply Wall St has no position in any stocks mentioned.
About OM:OSSD
OssDsign
Designs, manufactures, and sells implants and material technology for bone regeneration in Sweden, Germany, the United States, the United Kingdom, rest of Europe, and internationally.
Flawless balance sheet with high growth potential.
Market Insights
Community Narratives


