- Sweden
- /
- Capital Markets
- /
- OM:SFL
A Piece Of The Puzzle Missing From Safello Group AB (publ)'s (STO:SFL) 27% Share Price Climb


Safello Group AB (publ) (STO:SFL) shareholders have had their patience rewarded with a 27% share price jump in the last month. Unfortunately, despite the strong performance over the last month, the full year gain of 7.3% isn't as attractive.
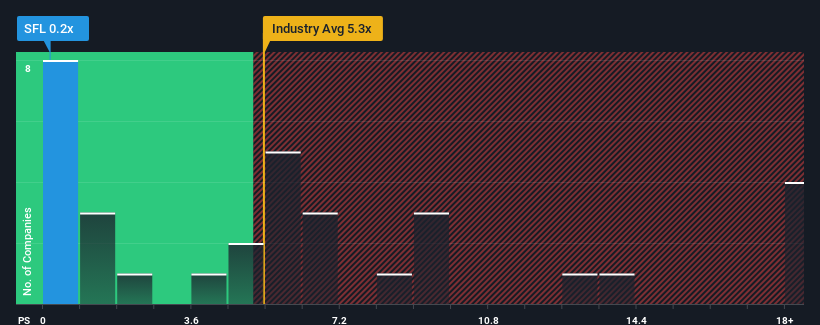
Even after such a large jump in price, Safello Group may still look like a strong buying opportunity at present with its price-to-sales (or "P/S") ratio of 0.2x, considering almost half of all companies in the Capital Markets industry in Sweden have P/S ratios greater than 5.3x and even P/S higher than 10x aren't out of the ordinary. Nonetheless, we'd need to dig a little deeper to determine if there is a rational basis for the highly reduced P/S.
See our latest analysis for Safello Group
What Does Safello Group's P/S Mean For Shareholders?
As an illustration, revenue has deteriorated at Safello Group over the last year, which is not ideal at all. Perhaps the market believes the recent revenue performance isn't good enough to keep up the industry, causing the P/S ratio to suffer. Those who are bullish on Safello Group will be hoping that this isn't the case so that they can pick up the stock at a lower valuation.
Want the full picture on earnings, revenue and cash flow for the company? Then our free report on Safello Group will help you shine a light on its historical performance.What Are Revenue Growth Metrics Telling Us About The Low P/S?
In order to justify its P/S ratio, Safello Group would need to produce anemic growth that's substantially trailing the industry.
Taking a look back first, the company's revenue growth last year wasn't something to get excited about as it posted a disappointing decline of 12%. Even so, admirably revenue has lifted 78% in aggregate from three years ago, notwithstanding the last 12 months. Accordingly, while they would have preferred to keep the run going, shareholders would definitely welcome the medium-term rates of revenue growth.
It's interesting to note that the rest of the industry is similarly expected to grow by 20% over the next year, which is fairly even with the company's recent medium-term annualised growth rates.
With this information, we find it odd that Safello Group is trading at a P/S lower than the industry. It may be that most investors are not convinced the company can maintain recent growth rates.
The Bottom Line On Safello Group's P/S
Even after such a strong price move, Safello Group's P/S still trails the rest of the industry. We'd say the price-to-sales ratio's power isn't primarily as a valuation instrument but rather to gauge current investor sentiment and future expectations.
Our examination of Safello Group revealed its three-year revenue trends looking similar to current industry expectations hasn't given the P/S the boost we expected, given that it's lower than the wider industry P/S, There could be some unobserved threats to revenue preventing the P/S ratio from matching the company's performance. While recent
Don't forget that there may be other risks. For instance, we've identified 3 warning signs for Safello Group that you should be aware of.
If companies with solid past earnings growth is up your alley, you may wish to see this free collection of other companies with strong earnings growth and low P/E ratios.
If you're looking to trade Safello Group, open an account with the lowest-cost platform trusted by professionals, Interactive Brokers.
With clients in over 200 countries and territories, and access to 160 markets, IBKR lets you trade stocks, options, futures, forex, bonds and funds from a single integrated account.
Enjoy no hidden fees, no account minimums, and FX conversion rates as low as 0.03%, far better than what most brokers offer.
Sponsored ContentNew: Manage All Your Stock Portfolios in One Place
We've created the ultimate portfolio companion for stock investors, and it's free.
• Connect an unlimited number of Portfolios and see your total in one currency
• Be alerted to new Warning Signs or Risks via email or mobile
• Track the Fair Value of your stocks
Have feedback on this article? Concerned about the content? Get in touch with us directly. Alternatively, email editorial-team (at) simplywallst.com.
This article by Simply Wall St is general in nature. We provide commentary based on historical data and analyst forecasts only using an unbiased methodology and our articles are not intended to be financial advice. It does not constitute a recommendation to buy or sell any stock, and does not take account of your objectives, or your financial situation. We aim to bring you long-term focused analysis driven by fundamental data. Note that our analysis may not factor in the latest price-sensitive company announcements or qualitative material. Simply Wall St has no position in any stocks mentioned.
About OM:SFL
Safello Group
Provides a brokerage platform for individuals and businesses.
Flawless balance sheet with acceptable track record.
Similar Companies
Market Insights

Community Narratives

