Advertisement
- Sweden
- /
- Capital Markets
- /
- OM:ROKO B
Röko’s Share Price Rebounds 1.8%: Does Latest Dip Signal Opportunity?

Simply Wall St
Reviewed by Bailey Pemberton
Wondering what to do with Röko stock right now? You are not alone. The share price just closed at 1900.0, and if you have been watching closely, you have probably noticed a blend of cautious optimism and uncertainty in the recent numbers. Over the last week, Röko edged up by 1.8%, bouncing back a little from a tricky stretch that saw it fall by 4.6% over the past month. For those who have held on since the start of the year, it has been a tough ride, with the stock down 11.9% year-to-date.
Recent headlines around the company have been mostly centered on its strategic moves and shifts within its sector. While there has not been a dramatic piece of news to justify a major swing, ongoing coverage has hinted at changes in market sentiment. Investors seem to be wrestling with Röko's long-term growth story against the risk of near-term softness in its core business areas. This context matters because it shapes how the market is currently valuing Röko. This is also why some are questioning if the latest dip presents an opportunity or a warning sign.
When it comes to value, a quick glance at our model's valuation score reveals a striking number: 0. Röko did not meet any of the six standard undervaluation checks, which is a signal in itself. But numbers only tell part of the story. Next, let us break down the valuation methods behind this score. Stick around, because there is an even smarter way to judge a company's worth that we will unveil later in the article.
Röko scores just 0/6 on our valuation checks. See what other red flags we found in the full valuation breakdown.
Approach 1: Röko Excess Returns Analysis
The Excess Returns valuation model looks at how efficiently a company uses its capital by comparing profits generated to the true cost of its equity. In simple terms, it measures whether the business creates value above what investors could expect elsewhere with similar risk. This makes it a powerful tool for companies in asset-heavy industries such as Röko’s sector.
For Röko, the most recent figures are as follows:
- Book Value: SEK379.85 per share
- Stable Earnings per Share (EPS): SEK51.31 per share (Source: Median Return on Equity from the past 5 years.)
- Cost of Equity: SEK29.28 per share
- Excess Return: SEK22.03 per share
- Average Return on Equity: 10.84%
- Stable Book Value estimate: SEK473.32 per share (Source: Weighted future Book Value estimates from 2 analysts.)
Using this method, the model estimates an intrinsic value for Röko shares of SEK948.50. With the latest share price at SEK1,900.00, this suggests the stock is currently 100.3% overvalued compared to what its fundamentals support.
Result: OVERVALUED
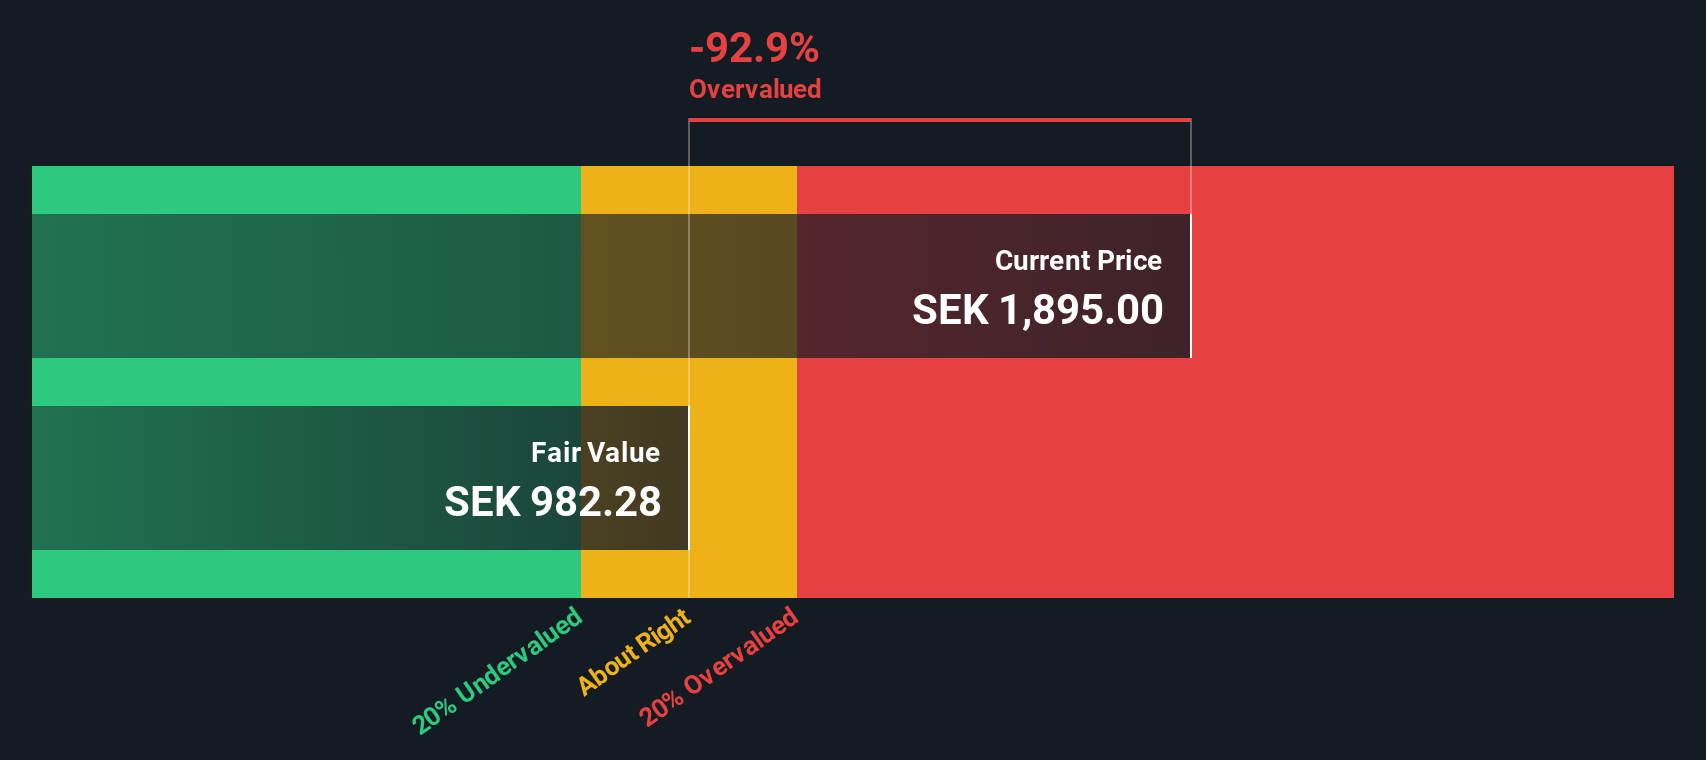
Our Excess Returns analysis suggests Röko may be overvalued by 100.3%. Find undervalued stocks or create your own screener to find better value opportunities.
Approach 2: Röko Price vs Earnings
For profitable companies like Röko, the Price-to-Earnings (PE) ratio is a widely used metric because it links a company’s share price directly to its bottom-line earnings. This makes it particularly telling for businesses with stable profitability as it captures what investors are willing to pay for each unit of profit generated.
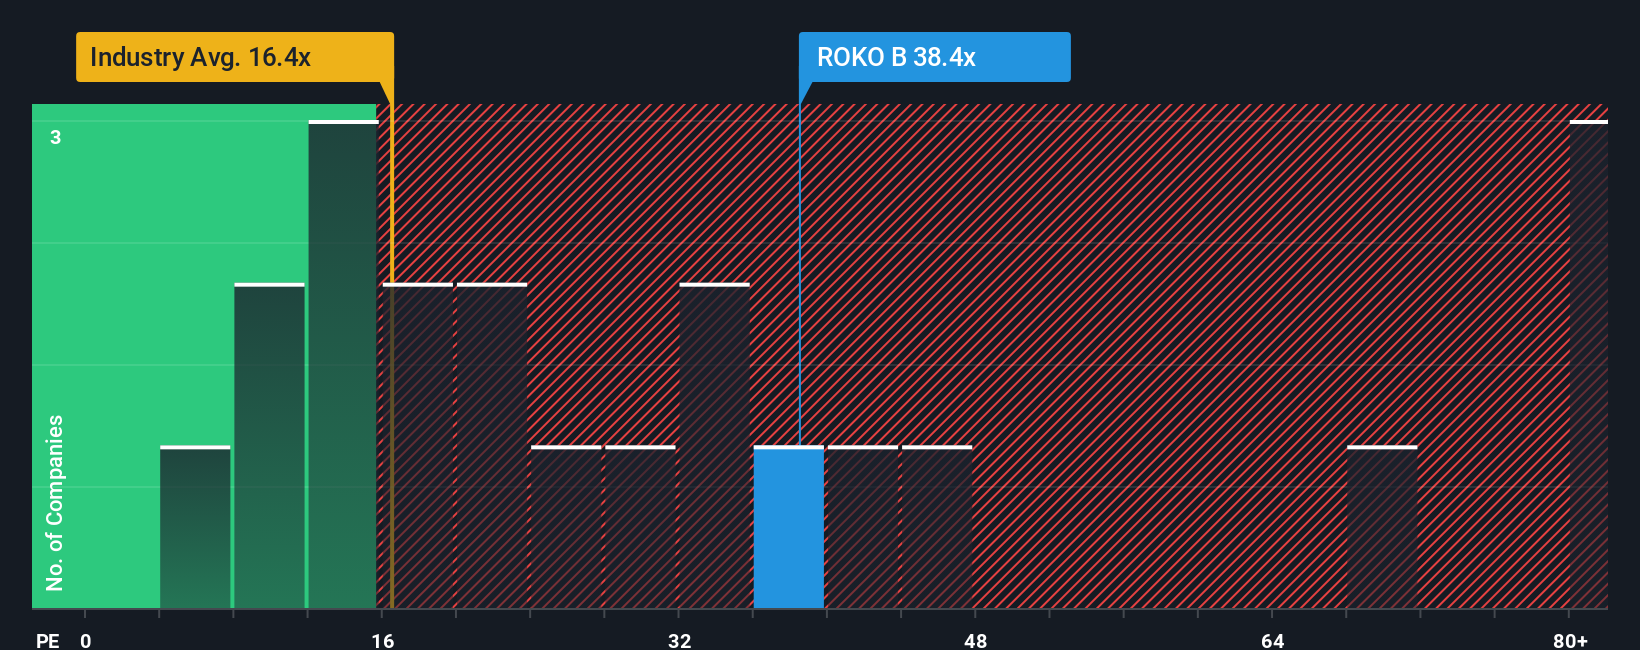
The “right” PE ratio depends on factors such as growth expectations and the level of risk. Generally, higher growth or lower risk justifies a higher PE, while slower growth or higher risk pulls it downward. In Röko’s case, the current PE stands at 38.32x. To provide context, the Capital Markets sector averages a PE of 18.82x, while direct peers are at 19.47x.
While industry and peer comparisons are useful, Simply Wall St’s Fair Ratio offers a more tailored benchmark. This proprietary measure factors in Röko’s specific earnings growth prospects, market risks, profit margins, industry, and even market cap. This offers a truer reflection of what is “fair” for Röko. Here, Röko’s Fair Ratio comes in at 21.63x.
Stacking these up, Röko's 38.32x PE is significantly higher than both the sector, peers, and its own Fair Ratio. This suggests that the stock is richly valued relative to its fundamentals right now.
Result: OVERVALUED
PE ratios tell one story, but what if the real opportunity lies elsewhere? Discover companies where insiders are betting big on explosive growth.
Upgrade Your Decision Making: Choose your Röko Narrative
Earlier we mentioned that there is an even better way to understand valuation. Let us introduce you to Narratives. In simple terms, a Narrative is your story or perspective about a company, translating your expectations for Röko’s future revenue, profits, and margins into a personalized fair value. By linking your view of the business story to a concrete financial forecast and valuation, Narratives let you see how your beliefs stack up against the current market price.
Millions of investors on Simply Wall St use Narratives on the Community page to easily build and compare these story-driven forecasts. This means you can decide for yourself whether Röko is worth buying or not, based on your own Fair Value estimate versus its latest price. Narratives update automatically when new earnings, forecasts, or news emerge, so your view stays relevant and up to date.
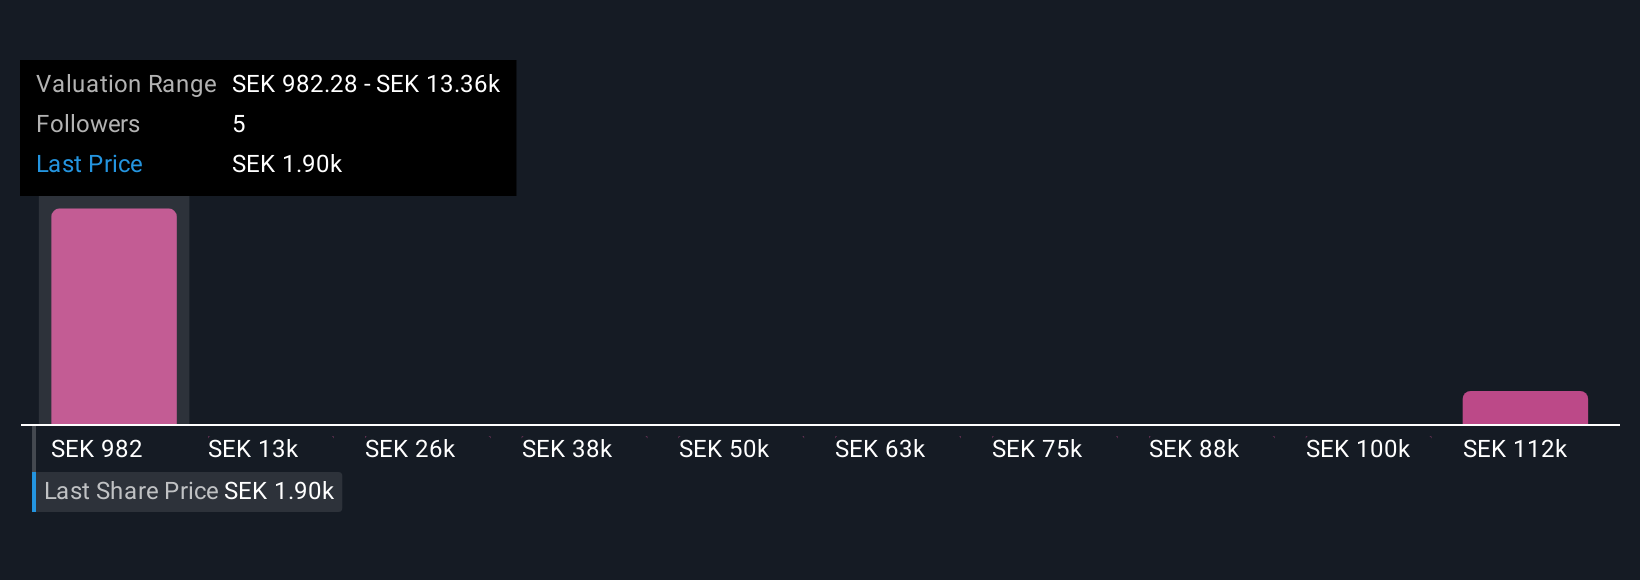
For instance, looking at the highest and lowest community Narratives for Röko, you will see some investors expecting strong growth and a much higher fair value, while others are more cautious and set their fair value far below the current price.
Do you think there's more to the story for Röko? Create your own Narrative to let the Community know!
This article by Simply Wall St is general in nature. We provide commentary based on historical data and analyst forecasts only using an unbiased methodology and our articles are not intended to be financial advice. It does not constitute a recommendation to buy or sell any stock, and does not take account of your objectives, or your financial situation. We aim to bring you long-term focused analysis driven by fundamental data. Note that our analysis may not factor in the latest price-sensitive company announcements or qualitative material. Simply Wall St has no position in any stocks mentioned.
New: AI Stock Screener & Alerts
Our new AI Stock Screener scans the market every day to uncover opportunities.
• Dividend Powerhouses (3%+ Yield)
• Undervalued Small Caps with Insider Buying
• High growth Tech and AI Companies
Or build your own from over 50 metrics.
Have feedback on this article? Concerned about the content? Get in touch with us directly. Alternatively, email editorial-team@simplywallst.com
About OM:ROKO B
Röko
A private equity firm specializes in small- and medium-sized businesses.
Excellent balance sheet with acceptable track record.
Market Insights

Advertisement
Community Narratives
Finding The True Value Of A Logistics Powerhouse
Fair Value US$95.21|8.4% undervalued
NV
Community Contributor
Paradigm Biopharmaceuticals Will Lead Osteoarthritis Treatment with Zilosul's FDA Success
Fair Value AU$5.50|92.1% undervalued
AM
Community Contributor
Barrick Mining (ABX:CA): A Gold Hedge against a U.S. Shutdown
Fair Value CA$60.00|24.2% undervalued
GM
Community Contributor