
Advertisement
Thule Group AB (publ)'s (STO:THULE) Stock Has Shown Weakness Lately But Financial Prospects Look Decent: Is The Market Wrong?
With its stock down 9.6% over the past month, it is easy to disregard Thule Group (STO:THULE). However, the company's fundamentals look pretty decent, and long-term financials are usually aligned with future market price movements. Particularly, we will be paying attention to Thule Group's ROE today.
Return on Equity or ROE is a test of how effectively a company is growing its value and managing investors’ money. Simply put, it is used to assess the profitability of a company in relation to its equity capital.
Check out our latest analysis for Thule Group
How Do You Calculate Return On Equity?
The formula for ROE is:
Return on Equity = Net Profit (from continuing operations) ÷ Shareholders' Equity
So, based on the above formula, the ROE for Thule Group is:
15% = kr1.1b ÷ kr7.5b (Based on the trailing twelve months to March 2024).
The 'return' is the yearly profit. Another way to think of that is that for every SEK1 worth of equity, the company was able to earn SEK0.15 in profit.
What Is The Relationship Between ROE And Earnings Growth?
We have already established that ROE serves as an efficient profit-generating gauge for a company's future earnings. Depending on how much of these profits the company reinvests or "retains", and how effectively it does so, we are then able to assess a company’s earnings growth potential. Generally speaking, other things being equal, firms with a high return on equity and profit retention, have a higher growth rate than firms that don’t share these attributes.
Thule Group's Earnings Growth And 15% ROE
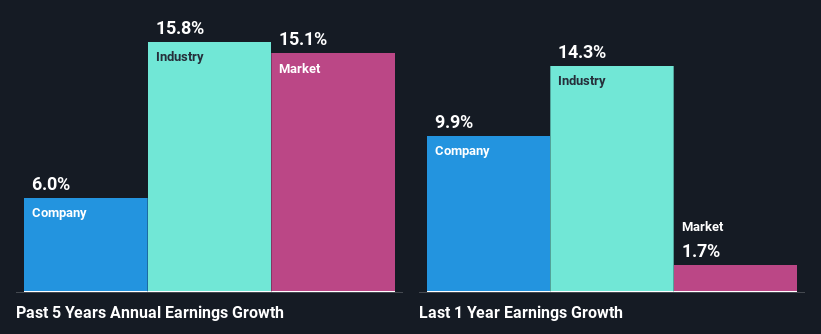
At first glance, Thule Group seems to have a decent ROE. Even when compared to the industry average of 16% the company's ROE looks quite decent. This certainly adds some context to Thule Group's moderate 6.0% net income growth seen over the past five years.
Next, on comparing with the industry net income growth, we found that Thule Group's reported growth was lower than the industry growth of 16% over the last few years, which is not something we like to see.
Earnings growth is an important metric to consider when valuing a stock. It’s important for an investor to know whether the market has priced in the company's expected earnings growth (or decline). Doing so will help them establish if the stock's future looks promising or ominous. Is THULE fairly valued? This infographic on the company's intrinsic value has everything you need to know.
Is Thule Group Efficiently Re-investing Its Profits?
While Thule Group has a three-year median payout ratio of 76% (which means it retains 24% of profits), the company has still seen a fair bit of earnings growth in the past, meaning that its high payout ratio hasn't hampered its ability to grow.
Moreover, Thule Group is determined to keep sharing its profits with shareholders which we infer from its long history of nine years of paying a dividend. Based on the latest analysts' estimates, we found that the company's future payout ratio over the next three years is expected to hold steady at 74%. Regardless, the future ROE for Thule Group is predicted to rise to 20% despite there being not much change expected in its payout ratio.
Summary
In total, it does look like Thule Group has some positive aspects to its business. Its earnings growth is decent, and the high ROE does contribute to that growth. However, investors could have benefitted even more from the high ROE, had the company been reinvesting more of its earnings. With that said, the latest industry analyst forecasts reveal that the company's earnings are expected to accelerate. Are these analysts expectations based on the broad expectations for the industry, or on the company's fundamentals? Click here to be taken to our analyst's forecasts page for the company.
Valuation is complex, but we're here to simplify it.
Discover if Thule Group might be undervalued or overvalued with our detailed analysis, featuring fair value estimates, potential risks, dividends, insider trades, and its financial condition.
Access Free AnalysisHave feedback on this article? Concerned about the content? Get in touch with us directly. Alternatively, email editorial-team (at) simplywallst.com.
This article by Simply Wall St is general in nature. We provide commentary based on historical data and analyst forecasts only using an unbiased methodology and our articles are not intended to be financial advice. It does not constitute a recommendation to buy or sell any stock, and does not take account of your objectives, or your financial situation. We aim to bring you long-term focused analysis driven by fundamental data. Note that our analysis may not factor in the latest price-sensitive company announcements or qualitative material. Simply Wall St has no position in any stocks mentioned.
Have feedback on this article? Concerned about the content? Get in touch with us directly. Alternatively, email editorial-team@simplywallst.com
About OM:THULE
Good value average dividend payer.
Similar Companies
Market Insights

Advertisement
Community Narratives
MINISO's fair value is projected at 26.69 with an anticipated PE ratio shift of 20x
Fair Value US$24.03|11.0% undervalued
BE
Community Contributor
Procter & Gamble: A Dividend Giant Facing Slowing Growth
Fair Value US$119.81|23.3% overvalued
AN
Community Contributor
Eli Lilly's Future Growth Driven by Tirzepatide and Favorable Market Conditions
Fair Value US$1.19k|13.8% undervalued
EA
Community Contributor