
Advertisement
- Sweden
- /
- Consumer Durables
- /
- OM:CANDLE B
Candles Scandinavia AB (publ)'s (STO:CANDLE B) 43% Share Price Surge Not Quite Adding Up
Candles Scandinavia AB (publ) (STO:CANDLE B) shares have continued their recent momentum with a 43% gain in the last month alone. The last 30 days bring the annual gain to a very sharp 77%.
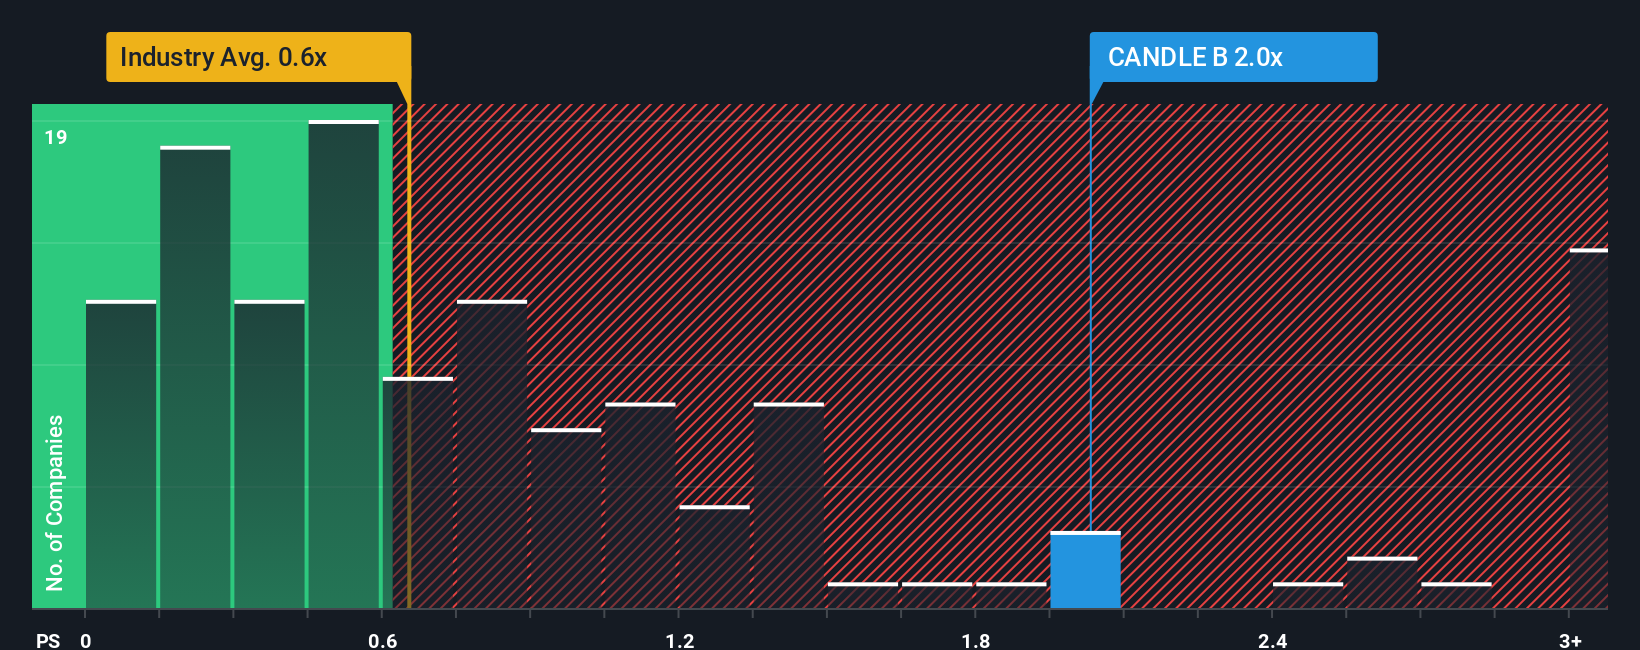
Following the firm bounce in price, you could be forgiven for thinking Candles Scandinavia is a stock not worth researching with a price-to-sales ratios (or "P/S") of 2x, considering almost half the companies in Sweden's Consumer Durables industry have P/S ratios below 0.6x. However, the P/S might be high for a reason and it requires further investigation to determine if it's justified.
Check out our latest analysis for Candles Scandinavia
How Has Candles Scandinavia Performed Recently?
For example, consider that Candles Scandinavia's financial performance has been pretty ordinary lately as revenue growth is non-existent. One possibility is that the P/S is high because investors think the benign revenue growth will improve to outperform the broader industry in the near future. However, if this isn't the case, investors might get caught out paying too much for the stock.
Although there are no analyst estimates available for Candles Scandinavia, take a look at this free data-rich visualisation to see how the company stacks up on earnings, revenue and cash flow.How Is Candles Scandinavia's Revenue Growth Trending?
The only time you'd be truly comfortable seeing a P/S as high as Candles Scandinavia's is when the company's growth is on track to outshine the industry.
If we review the last year of revenue, the company posted a result that saw barely any deviation from a year ago. Fortunately, a few good years before that means that it was still able to grow revenue by 13% in total over the last three years. Accordingly, shareholders probably wouldn't have been overly satisfied with the unstable medium-term growth rates.
It's interesting to note that the rest of the industry is similarly expected to grow by 3.1% over the next year, which is fairly even with the company's recent medium-term annualised growth rates.
With this in mind, we find it intriguing that Candles Scandinavia's P/S exceeds that of its industry peers. It seems most investors are ignoring the fairly average recent growth rates and are willing to pay up for exposure to the stock. Although, additional gains will be difficult to achieve as a continuation of recent revenue trends would weigh down the share price eventually.
What Does Candles Scandinavia's P/S Mean For Investors?
Candles Scandinavia shares have taken a big step in a northerly direction, but its P/S is elevated as a result. Generally, our preference is to limit the use of the price-to-sales ratio to establishing what the market thinks about the overall health of a company.
Our examination of Candles Scandinavia revealed its three-year revenue trends aren't impacting its high P/S as much as we would have predicted, given they look similar to current industry expectations. When we see average revenue with industry-like growth combined with a high P/S, we suspect the share price is at risk of declining, bringing the P/S back in line with the industry too. If recent medium-term revenue trends continue, it will place shareholders' investments at risk and potential investors in danger of paying an unnecessary premium.
We don't want to rain on the parade too much, but we did also find 4 warning signs for Candles Scandinavia (2 make us uncomfortable!) that you need to be mindful of.
If strong companies turning a profit tickle your fancy, then you'll want to check out this free list of interesting companies that trade on a low P/E (but have proven they can grow earnings).
New: AI Stock Screener & Alerts
Our new AI Stock Screener scans the market every day to uncover opportunities.
• Dividend Powerhouses (3%+ Yield)
• Undervalued Small Caps with Insider Buying
• High growth Tech and AI Companies
Or build your own from over 50 metrics.
Have feedback on this article? Concerned about the content? Get in touch with us directly. Alternatively, email editorial-team (at) simplywallst.com.
This article by Simply Wall St is general in nature. We provide commentary based on historical data and analyst forecasts only using an unbiased methodology and our articles are not intended to be financial advice. It does not constitute a recommendation to buy or sell any stock, and does not take account of your objectives, or your financial situation. We aim to bring you long-term focused analysis driven by fundamental data. Note that our analysis may not factor in the latest price-sensitive company announcements or qualitative material. Simply Wall St has no position in any stocks mentioned.
About OM:CANDLE B
Candles Scandinavia
Manufactures and sells scented candles based on plant-based wax made of rapeseed oil.
High growth potential with excellent balance sheet.
Market Insights

Advertisement
Community Narratives
MicroVision will explode future revenue by 380.37% with a vision towards success
Fair Value US$60|98.4% undervalued
TH
Community Contributor
The Indispensable Artery for a New North American Economy
Fair Value CA$132.87|0.7% overvalued
TI
Community Contributor
Recently Updated Narratives
CE

cementafriend on Constellation Energy ·
Constellation Energy Dividends and Growth
Fair Value:US$348.054.7% overvalued
2 followersusers have followed this narrative
0 commentsusers have commented on this narrative
0 likesusers have liked this narrative
KH

Khagani on CoreWeave ·
CoreWeave's Revenue Expected to Rocket 77.88% in 5-Year Forecast
Fair Value:US$11033.5% undervalued
1 followerusers have followed this narrative
0 commentsusers have commented on this narrative
0 likesusers have liked this narrative
PO

PortfolioPlus on Bisalloy Steel Group ·
Bisalloy Steel Group will shine with a projected profit margin increase of 12.8%
Fair Value:AU$6.7118.0% undervalued
2 followersusers have followed this narrative
0 commentsusers have commented on this narrative
0 likesusers have liked this narrative
Popular Narratives
TH

TheWallstreetKing on MicroVision ·
MicroVision will explode future revenue by 380.37% with a vision towards success
Fair Value:US$6098.4% undervalued
103 followersusers have followed this narrative
10 commentsusers have commented on this narrative
20 likesusers have liked this narrative
AN


AnalystConsensusTarget on NVIDIA ·
NVDA: Expanding AI Demand Will Drive Major Data Center Investments Through 2026
Fair Value:US$250.3929.3% undervalued
936 followersusers have followed this narrative
6 commentsusers have commented on this narrative
23 likesusers have liked this narrative
OS


oscargarcia on Alphabet ·
The company that turned a verb into a global necessity and basically runs the modern internet, digital ads, smartphones, maps, and AI.
Fair Value:US$3405.8% undervalued
140 followersusers have followed this narrative
6 commentsusers have commented on this narrative
18 likesusers have liked this narrative