
Advertisement

Legendary fund manager Li Lu (who Charlie Munger backed) once said, 'The biggest investment risk is not the volatility of prices, but whether you will suffer a permanent loss of capital.' It's only natural to consider a company's balance sheet when you examine how risky it is, since debt is often involved when a business collapses. We note that Besqab AB (publ) (STO:BESQ) does have debt on its balance sheet. But the more important question is: how much risk is that debt creating?
What Risk Does Debt Bring?
Debt and other liabilities become risky for a business when it cannot easily fulfill those obligations, either with free cash flow or by raising capital at an attractive price. Ultimately, if the company can't fulfill its legal obligations to repay debt, shareholders could walk away with nothing. While that is not too common, we often do see indebted companies permanently diluting shareholders because lenders force them to raise capital at a distressed price. By replacing dilution, though, debt can be an extremely good tool for businesses that need capital to invest in growth at high rates of return. When we examine debt levels, we first consider both cash and debt levels, together.
Check out our latest analysis for Besqab
What Is Besqab's Net Debt?
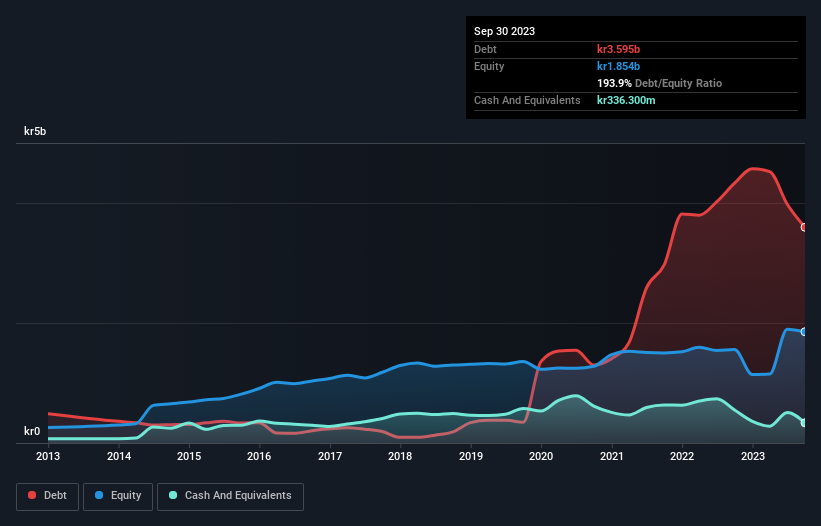
As you can see below, Besqab had kr3.60b of debt at September 2023, down from kr4.33b a year prior. However, it also had kr336.3m in cash, and so its net debt is kr3.26b.
How Healthy Is Besqab's Balance Sheet?
According to the last reported balance sheet, Besqab had liabilities of kr4.65b due within 12 months, and liabilities of kr328.8m due beyond 12 months. Offsetting these obligations, it had cash of kr336.3m as well as receivables valued at kr1.10b due within 12 months. So its liabilities total kr3.54b more than the combination of its cash and short-term receivables.
The deficiency here weighs heavily on the kr1.36b company itself, as if a child were struggling under the weight of an enormous back-pack full of books, his sports gear, and a trumpet. So we'd watch its balance sheet closely, without a doubt. At the end of the day, Besqab would probably need a major re-capitalization if its creditors were to demand repayment. There's no doubt that we learn most about debt from the balance sheet. But you can't view debt in total isolation; since Besqab will need earnings to service that debt. So when considering debt, it's definitely worth looking at the earnings trend. Click here for an interactive snapshot.
Over 12 months, Besqab reported revenue of kr2.1b, which is a gain of 28%, although it did not report any earnings before interest and tax. Shareholders probably have their fingers crossed that it can grow its way to profits.
Caveat Emptor
Despite the top line growth, Besqab still had an earnings before interest and tax (EBIT) loss over the last year. Its EBIT loss was a whopping kr384m. If you consider the significant liabilities mentioned above, we are extremely wary of this investment. Of course, it may be able to improve its situation with a bit of luck and good execution. Nevertheless, we would not bet on it given that it vaporized kr22m in cash over the last twelve months, and it doesn't have much by way of liquid assets. So we consider this a high risk stock and we wouldn't be at all surprised if the company asks shareholders for money before long. The balance sheet is clearly the area to focus on when you are analysing debt. But ultimately, every company can contain risks that exist outside of the balance sheet. For instance, we've identified 3 warning signs for Besqab that you should be aware of.
At the end of the day, it's often better to focus on companies that are free from net debt. You can access our special list of such companies (all with a track record of profit growth). It's free.
Valuation is complex, but we're here to simplify it.
Discover if Besqab might be undervalued or overvalued with our detailed analysis, featuring fair value estimates, potential risks, dividends, insider trades, and its financial condition.
Access Free AnalysisHave feedback on this article? Concerned about the content? Get in touch with us directly. Alternatively, email editorial-team (at) simplywallst.com.
This article by Simply Wall St is general in nature. We provide commentary based on historical data and analyst forecasts only using an unbiased methodology and our articles are not intended to be financial advice. It does not constitute a recommendation to buy or sell any stock, and does not take account of your objectives, or your financial situation. We aim to bring you long-term focused analysis driven by fundamental data. Note that our analysis may not factor in the latest price-sensitive company announcements or qualitative material. Simply Wall St has no position in any stocks mentioned.
About OM:BESQ
Good value with mediocre balance sheet.
Similar Companies
Market Insights

Advertisement
Community Narratives
Groundbreaking therapies that could change the treatment landscape for PTSD, fibromyalgia, MS & Alzheimer’s
Fair Value US$6.20|86.9% undervalued
CM
Community Contributor
DigitalOcean Will Grow 14% by Embracing AI with Paperspace Acquisition
Fair Value US$50.00|40.2% undervalued
NE
Community Contributor
Viant Technology: A Rising AdTech Challenger in the AI-Powered CTV Market
Fair Value US$38.61|62.7% undervalued
BL
Community Contributor
Volvo will Accelerate Forward into Electric and Autonomous Leadership in Five Years
Fair Value SEK 438.80|39.7% undervalued
UN
Community Contributor