
Advertisement
- Sweden
- /
- Professional Services
- /
- OM:WISE
Can Mixed Fundamentals Have A Negative Impact on Wise Group AB (publ) (STO:WISE) Current Share Price Momentum?

Most readers would already be aware that Wise Group's (STO:WISE) stock increased significantly by 17% over the past month. However, we wonder if the company's inconsistent financials would have any adverse impact on the current share price momentum. Particularly, we will be paying attention to Wise Group's ROE today.
Return on equity or ROE is an important factor to be considered by a shareholder because it tells them how effectively their capital is being reinvested. Simply put, it is used to assess the profitability of a company in relation to its equity capital.
See our latest analysis for Wise Group
How To Calculate Return On Equity?
ROE can be calculated by using the formula:
Return on Equity = Net Profit (from continuing operations) ÷ Shareholders' Equity
So, based on the above formula, the ROE for Wise Group is:
42% = kr60m ÷ kr142m (Based on the trailing twelve months to December 2021).
The 'return' is the yearly profit. That means that for every SEK1 worth of shareholders' equity, the company generated SEK0.42 in profit.
What Is The Relationship Between ROE And Earnings Growth?
So far, we've learned that ROE is a measure of a company's profitability. We now need to evaluate how much profit the company reinvests or "retains" for future growth which then gives us an idea about the growth potential of the company. Assuming everything else remains unchanged, the higher the ROE and profit retention, the higher the growth rate of a company compared to companies that don't necessarily bear these characteristics.
Wise Group's Earnings Growth And 42% ROE
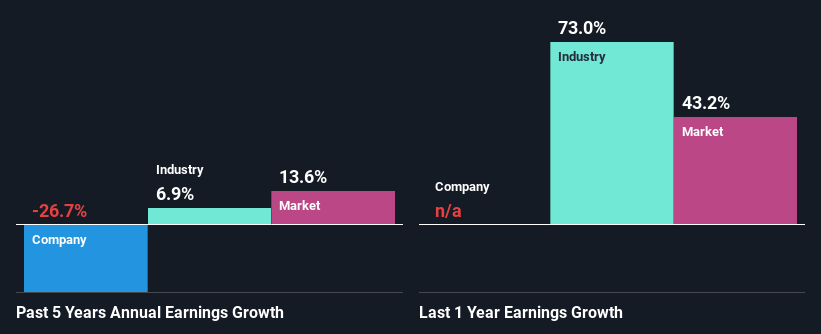
Firstly, we acknowledge that Wise Group has a significantly high ROE. Second, a comparison with the average ROE reported by the industry of 22% also doesn't go unnoticed by us. For this reason, Wise Group's five year net income decline of 27% raises the question as to why the high ROE didn't translate into earnings growth. We reckon that there could be some other factors at play here that are preventing the company's growth. For example, it could be that the company has a high payout ratio or the business has allocated capital poorly, for instance.
That being said, we compared Wise Group's performance with the industry and were concerned when we found that while the company has shrunk its earnings, the industry has grown its earnings at a rate of 6.9% in the same period.
Earnings growth is an important metric to consider when valuing a stock. It’s important for an investor to know whether the market has priced in the company's expected earnings growth (or decline). By doing so, they will have an idea if the stock is headed into clear blue waters or if swampy waters await. Has the market priced in the future outlook for WISE? You can find out in our latest intrinsic value infographic research report
Is Wise Group Using Its Retained Earnings Effectively?
Wise Group's very high three-year median payout ratio of 143% over the last three years suggests that the company is paying its shareholders more than what it is earning and this explains the company's shrinking earnings. Its usually very hard to sustain dividend payments that are higher than reported profits. Our risks dashboard should have the 4 risks we have identified for Wise Group.
Additionally, Wise Group has paid dividends over a period of at least ten years, which means that the company's management is determined to pay dividends even if it means little to no earnings growth.
Summary
In total, we're a bit ambivalent about Wise Group's performance. In spite of the high ROE, the company has failed to see growth in its earnings due to it paying out most of its profits as dividend, with almost nothing left to invest into its own business. So far, we've only made a quick discussion around the company's earnings growth. So it may be worth checking this free detailed graph of Wise Group's past earnings, as well as revenue and cash flows to get a deeper insight into the company's performance.
Valuation is complex, but we're here to simplify it.
Discover if Wise Group might be undervalued or overvalued with our detailed analysis, featuring fair value estimates, potential risks, dividends, insider trades, and its financial condition.
Access Free AnalysisHave feedback on this article? Concerned about the content? Get in touch with us directly. Alternatively, email editorial-team (at) simplywallst.com.
This article by Simply Wall St is general in nature. We provide commentary based on historical data and analyst forecasts only using an unbiased methodology and our articles are not intended to be financial advice. It does not constitute a recommendation to buy or sell any stock, and does not take account of your objectives, or your financial situation. We aim to bring you long-term focused analysis driven by fundamental data. Note that our analysis may not factor in the latest price-sensitive company announcements or qualitative material. Simply Wall St has no position in any stocks mentioned.
About OM:WISE
Wise Group
Engages in the provision of recruitment and consultancy services in Sweden, Finland, and Denmark.
Flawless balance sheet and slightly overvalued.
Market Insights


Advertisement
Community Narratives
The Future of Drug Testing? Fingerprint Tech Shows Serious Promise
Fair Value US$2.98|40.3% undervalued
JO
Community Contributor
Suncorp’s Next Chapter: Insurance-Only and Ready to Grow
Fair Value AU$22.83|7.9% undervalued
RO
Community Contributor
Thyssenkrupp Nucera Will Achieve Double-Digit Profits by 2030 Boosted by Hydrogen Growth
Fair Value €14.40|31.6% undervalued
CH
Community Contributor
Tesla’s Nvidia Moment – The AI & Robotics Inflection Point
Fair Value US$359.72|12.3% undervalued
BL
Community Contributor