
Advertisement
- Sweden
- /
- Commercial Services
- /
- OM:SECI
Market Cool On SECITS Holding AB (publ)'s (STO:SECI) Revenues Pushing Shares 40% Lower

SECITS Holding AB (publ) (STO:SECI) shareholders that were waiting for something to happen have been dealt a blow with a 40% share price drop in the last month. For any long-term shareholders, the last month ends a year to forget by locking in a 93% share price decline.
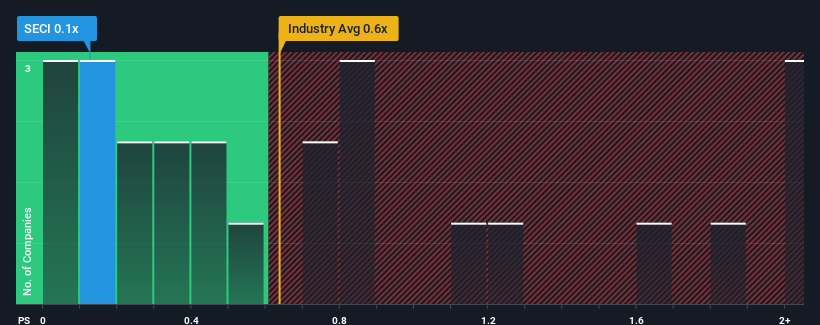
After such a large drop in price, considering around half the companies operating in Sweden's Commercial Services industry have price-to-sales ratios (or "P/S") above 0.6x, you may consider SECITS Holding as an solid investment opportunity with its 0.1x P/S ratio. Although, it's not wise to just take the P/S at face value as there may be an explanation why it's limited.
Check out our latest analysis for SECITS Holding
How SECITS Holding Has Been Performing
For instance, SECITS Holding's receding revenue in recent times would have to be some food for thought. It might be that many expect the disappointing revenue performance to continue or accelerate, which has repressed the P/S. However, if this doesn't eventuate then existing shareholders may be feeling optimistic about the future direction of the share price.
We don't have analyst forecasts, but you can see how recent trends are setting up the company for the future by checking out our free report on SECITS Holding's earnings, revenue and cash flow.Is There Any Revenue Growth Forecasted For SECITS Holding?
SECITS Holding's P/S ratio would be typical for a company that's only expected to deliver limited growth, and importantly, perform worse than the industry.
Taking a look back first, the company's revenue growth last year wasn't something to get excited about as it posted a disappointing decline of 21%. However, a few very strong years before that means that it was still able to grow revenue by an impressive 249% in total over the last three years. So we can start by confirming that the company has generally done a very good job of growing revenue over that time, even though it had some hiccups along the way.
When compared to the industry's one-year growth forecast of 4.8%, the most recent medium-term revenue trajectory is noticeably more alluring
With this information, we find it odd that SECITS Holding is trading at a P/S lower than the industry. Apparently some shareholders believe the recent performance has exceeded its limits and have been accepting significantly lower selling prices.
What We Can Learn From SECITS Holding's P/S?
The southerly movements of SECITS Holding's shares means its P/S is now sitting at a pretty low level. While the price-to-sales ratio shouldn't be the defining factor in whether you buy a stock or not, it's quite a capable barometer of revenue expectations.
Our examination of SECITS Holding revealed its three-year revenue trends aren't boosting its P/S anywhere near as much as we would have predicted, given they look better than current industry expectations. When we see strong revenue with faster-than-industry growth, we assume there are some significant underlying risks to the company's ability to make money which is applying downwards pressure on the P/S ratio. At least price risks look to be very low if recent medium-term revenue trends continue, but investors seem to think future revenue could see a lot of volatility.
There are also other vital risk factors to consider before investing and we've discovered 5 warning signs for SECITS Holding that you should be aware of.
If companies with solid past earnings growth is up your alley, you may wish to see this free collection of other companies with strong earnings growth and low P/E ratios.
New: Manage All Your Stock Portfolios in One Place
We've created the ultimate portfolio companion for stock investors, and it's free.
• Connect an unlimited number of Portfolios and see your total in one currency
• Be alerted to new Warning Signs or Risks via email or mobile
• Track the Fair Value of your stocks
Have feedback on this article? Concerned about the content? Get in touch with us directly. Alternatively, email editorial-team (at) simplywallst.com.
This article by Simply Wall St is general in nature. We provide commentary based on historical data and analyst forecasts only using an unbiased methodology and our articles are not intended to be financial advice. It does not constitute a recommendation to buy or sell any stock, and does not take account of your objectives, or your financial situation. We aim to bring you long-term focused analysis driven by fundamental data. Note that our analysis may not factor in the latest price-sensitive company announcements or qualitative material. Simply Wall St has no position in any stocks mentioned.
About OM:SECI
SECITS Holding
Provides surveillance cameras and camera surveillance services in Sweden.
Slight and slightly overvalued.
Market Insights

Advertisement
Community Narratives
Groundbreaking therapies that could change the treatment landscape for PTSD, fibromyalgia, MS & Alzheimer’s
Fair Value US$6.20|82.7% undervalued
CM
Community Contributor
DigitalOcean Will Grow 14% by Embracing AI with Paperspace Acquisition
Fair Value US$50.00|36.8% undervalued
NE
Community Contributor
Viant Technology: A Rising AdTech Challenger in the AI-Powered CTV Market
Fair Value US$38.61|61.4% undervalued
BL
Community Contributor
Volvo will Accelerate Forward into Electric and Autonomous Leadership in Five Years
Fair Value SEK 438.80|37.1% undervalued
UN
Community Contributor