
Advertisement
- Sweden
- /
- Commercial Services
- /
- OM:SAXG
Saxlund Group's (STO:SAXG) Shareholders Are Down 50% On Their Investment Over The Past Three Years.
This week we saw the Saxlund Group AB (publ) (STO:SAXG) share price climb by 24%. But that doesn't change the fact that the returns over the last three years have been less than pleasing. After all, the share price is down 83% in the last three years, significantly under-performing the market.
We really hope anyone holding through that price crash has a diversified portfolio. Even when you lose money, you don't have to lose the lesson.
Check out our latest analysis for Saxlund Group
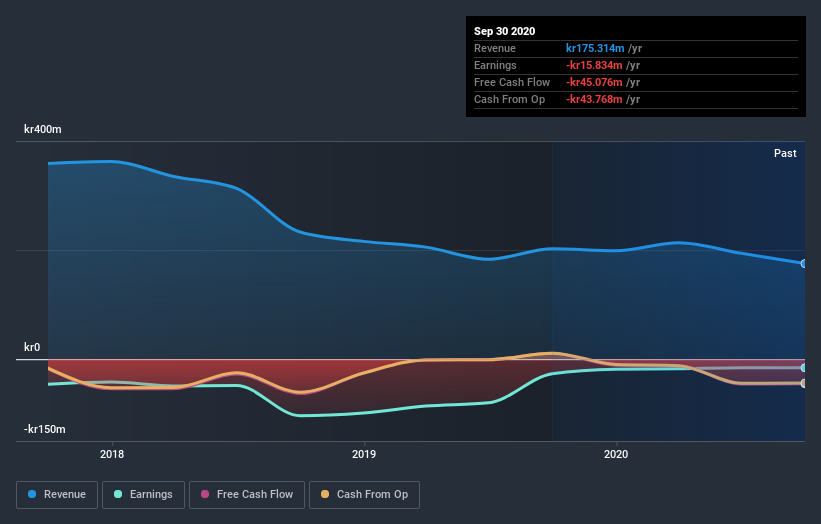
Saxlund Group isn't currently profitable, so most analysts would look to revenue growth to get an idea of how fast the underlying business is growing. Generally speaking, companies without profits are expected to grow revenue every year, and at a good clip. That's because fast revenue growth can be easily extrapolated to forecast profits, often of considerable size.
Over the last three years, Saxlund Group's revenue dropped 26% per year. That means its revenue trend is very weak compared to other loss making companies. The swift share price decline at an annual compound rate of 22%, reflects this weak fundamental performance. Never forget that loss making companies with falling revenue can and do cause losses for everyday investors. There is a good reason that investors often describe buying a sharply falling stock price as 'trying to catch a falling knife'. Think about it.
The company's revenue and earnings (over time) are depicted in the image below (click to see the exact numbers).
Take a more thorough look at Saxlund Group's financial health with this free report on its balance sheet.
What about the Total Shareholder Return (TSR)?
We'd be remiss not to mention the difference between Saxlund Group's total shareholder return (TSR) and its share price return. The TSR is a return calculation that accounts for the value of cash dividends (assuming that any dividend received was reinvested) and the calculated value of any discounted capital raisings and spin-offs. We note that Saxlund Group's TSR, at -50% is higher than its share price return of -83%. When you consider it hasn't been paying a dividend, this data suggests shareholders have benefitted from a spin-off, or had the opportunity to acquire attractively priced shares in a discounted capital raising.
A Different Perspective
It's nice to see that Saxlund Group shareholders have gained 44% (in total) over the last year. That certainly beats the loss of about 14% per year over three years. We're generally cautious about putting too much weigh on shorter term data, but the recent improvement is definitely a positive. It's always interesting to track share price performance over the longer term. But to understand Saxlund Group better, we need to consider many other factors. Case in point: We've spotted 4 warning signs for Saxlund Group you should be aware of, and 2 of them are concerning.
For those who like to find winning investments this free list of growing companies with recent insider purchasing, could be just the ticket.
Please note, the market returns quoted in this article reflect the market weighted average returns of stocks that currently trade on SE exchanges.
When trading Saxlund Group or any other investment, use the platform considered by many to be the Professional's Gateway to the Worlds Market, Interactive Brokers. You get the lowest-cost* trading on stocks, options, futures, forex, bonds and funds worldwide from a single integrated account. Promoted
New: Manage All Your Stock Portfolios in One Place
We've created the ultimate portfolio companion for stock investors, and it's free.
• Connect an unlimited number of Portfolios and see your total in one currency
• Be alerted to new Warning Signs or Risks via email or mobile
• Track the Fair Value of your stocks
This article by Simply Wall St is general in nature. It does not constitute a recommendation to buy or sell any stock, and does not take account of your objectives, or your financial situation. We aim to bring you long-term focused analysis driven by fundamental data. Note that our analysis may not factor in the latest price-sensitive company announcements or qualitative material. Simply Wall St has no position in any stocks mentioned.
*Interactive Brokers Rated Lowest Cost Broker by StockBrokers.com Annual Online Review 2020
Have feedback on this article? Concerned about the content? Get in touch with us directly. Alternatively, email editorial-team@simplywallst.com.
About OM:SAXG
Saxlund Group
An environmental technology group, develops, manufactures, and services plants and equipment for the production of environmental-friendly and resource-efficient energy.
Adequate balance sheet with low risk.
Market Insights

Advertisement
Community Narratives
MicroVision will explode future revenue by 380.37% with a vision towards success
Fair Value US$60|98.4% undervalued
TH
Community Contributor
The Indispensable Artery for a New North American Economy
Fair Value CA$132.87|0.7% overvalued
TI
Community Contributor
Recently Updated Narratives
NI

niteco on Texas Instruments ·
Engineered for Stability. Positioned for Growth.
Fair Value:US$314.4446.5% undervalued
1 followerusers have followed this narrative
0 commentsusers have commented on this narrative
0 likesusers have liked this narrative
BE


Bejgal on MINISO Group Holding ·
MINISO's fair value is projected at 26.69 with an anticipated PE ratio shift of 20x
Fair Value:US$28.1829.5% undervalued
46 followersusers have followed this narrative
3 commentsusers have commented on this narrative
0 likesusers have liked this narrative
BE

Bejgal on Fiverr International ·
Fiverr International will transform the freelance industry with AI-powered growth
Fair Value:US$36.8143.1% undervalued
79 followersusers have followed this narrative
7 commentsusers have commented on this narrative
0 likesusers have liked this narrative
Popular Narratives
TH

TheWallstreetKing on MicroVision ·
MicroVision will explode future revenue by 380.37% with a vision towards success
Fair Value:US$6098.4% undervalued
109 followersusers have followed this narrative
10 commentsusers have commented on this narrative
21 likesusers have liked this narrative
AN


AnalystConsensusTarget on NVIDIA ·
NVDA: Expanding AI Demand Will Drive Major Data Center Investments Through 2026
Fair Value:US$250.3929.3% undervalued
939 followersusers have followed this narrative
6 commentsusers have commented on this narrative
24 likesusers have liked this narrative
OS


oscargarcia on Alphabet ·
The company that turned a verb into a global necessity and basically runs the modern internet, digital ads, smartphones, maps, and AI.
Fair Value:US$3405.8% undervalued
145 followersusers have followed this narrative
6 commentsusers have commented on this narrative
18 likesusers have liked this narrative