
Advertisement
The external fund manager backed by Berkshire Hathaway's Charlie Munger, Li Lu, makes no bones about it when he says 'The biggest investment risk is not the volatility of prices, but whether you will suffer a permanent loss of capital.' When we think about how risky a company is, we always like to look at its use of debt, since debt overload can lead to ruin. We note that Saxlund Group AB (publ) (STO:SAXG) does have debt on its balance sheet. But should shareholders be worried about its use of debt?
Why Does Debt Bring Risk?
Debt and other liabilities become risky for a business when it cannot easily fulfill those obligations, either with free cash flow or by raising capital at an attractive price. In the worst case scenario, a company can go bankrupt if it cannot pay its creditors. However, a more common (but still painful) scenario is that it has to raise new equity capital at a low price, thus permanently diluting shareholders. Having said that, the most common situation is where a company manages its debt reasonably well - and to its own advantage. The first thing to do when considering how much debt a business uses is to look at its cash and debt together.
View our latest analysis for Saxlund Group
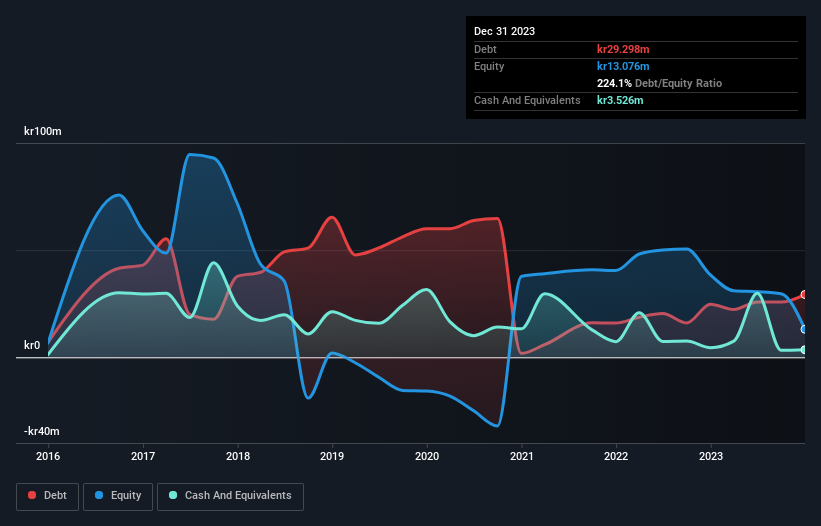
What Is Saxlund Group's Debt?
As you can see below, at the end of December 2023, Saxlund Group had kr29.3m of debt, up from kr24.8m a year ago. Click the image for more detail. On the flip side, it has kr3.53m in cash leading to net debt of about kr25.8m.
A Look At Saxlund Group's Liabilities
Zooming in on the latest balance sheet data, we can see that Saxlund Group had liabilities of kr167.0m due within 12 months and liabilities of kr18.5m due beyond that. On the other hand, it had cash of kr3.53m and kr48.9m worth of receivables due within a year. So it has liabilities totalling kr133.1m more than its cash and near-term receivables, combined.
This deficit casts a shadow over the kr57.7m company, like a colossus towering over mere mortals. So we'd watch its balance sheet closely, without a doubt. At the end of the day, Saxlund Group would probably need a major re-capitalization if its creditors were to demand repayment. There's no doubt that we learn most about debt from the balance sheet. But it is Saxlund Group's earnings that will influence how the balance sheet holds up in the future. So if you're keen to discover more about its earnings, it might be worth checking out this graph of its long term earnings trend.
Over 12 months, Saxlund Group reported revenue of kr308m, which is a gain of 23%, although it did not report any earnings before interest and tax. Shareholders probably have their fingers crossed that it can grow its way to profits.
Caveat Emptor
Despite the top line growth, Saxlund Group still had an earnings before interest and tax (EBIT) loss over the last year. Indeed, it lost a very considerable kr20m at the EBIT level. When we look at that alongside the significant liabilities, we're not particularly confident about the company. It would need to improve its operations quickly for us to be interested in it. Not least because it burned through kr6.8m in negative free cash flow over the last year. So suffice it to say we consider the stock to be risky. The balance sheet is clearly the area to focus on when you are analysing debt. However, not all investment risk resides within the balance sheet - far from it. For example, we've discovered 2 warning signs for Saxlund Group that you should be aware of before investing here.
When all is said and done, sometimes its easier to focus on companies that don't even need debt. Readers can access a list of growth stocks with zero net debt 100% free, right now.
New: Manage All Your Stock Portfolios in One Place
We've created the ultimate portfolio companion for stock investors, and it's free.
• Connect an unlimited number of Portfolios and see your total in one currency
• Be alerted to new Warning Signs or Risks via email or mobile
• Track the Fair Value of your stocks
Have feedback on this article? Concerned about the content? Get in touch with us directly. Alternatively, email editorial-team (at) simplywallst.com.
This article by Simply Wall St is general in nature. We provide commentary based on historical data and analyst forecasts only using an unbiased methodology and our articles are not intended to be financial advice. It does not constitute a recommendation to buy or sell any stock, and does not take account of your objectives, or your financial situation. We aim to bring you long-term focused analysis driven by fundamental data. Note that our analysis may not factor in the latest price-sensitive company announcements or qualitative material. Simply Wall St has no position in any stocks mentioned.
About OM:SAXG
Saxlund Group
An environmental technology group, develops, manufactures, and services plants and equipment for the production of environmental-friendly and resource-efficient energy.
Moderate risk with adequate balance sheet.
Market Insights

Advertisement
Community Narratives
The Next Phase of Energy Storage: How NeoVolta Is Tackling America’s Power Crunch
Fair Value US$7.50|35.1% undervalued
MA
Community Contributor
Why EnSilica is Worth Possibly 13x its Current Price
Fair Value UK£5.00|89.8% undervalued
DO
Community Contributor
M&A Activity, Industry Diversification & A Defense Contract Monopoly Will Push BWXT For Healthy Long-Term Growth
Fair Value US$220.00|15.2% undervalued
CL
Community Contributor
A case for Cassiar Gold Corp (TSXV: GLDC) to reach CAD$8-10 before 2030 (X30-37)
Fair Value CA$10.00|96.0% undervalued
AG
Community Contributor