- Sweden
- /
- Commercial Services
- /
- OM:GIAB
Godsinlösen Nordic AB (publ)'s (STO:GIAB) Shares Climb 52% But Its Business Is Yet to Catch Up
Godsinlösen Nordic AB (publ) (STO:GIAB) shares have had a really impressive month, gaining 52% after a shaky period beforehand. Unfortunately, the gains of the last month did little to right the losses of the last year with the stock still down 43% over that time.
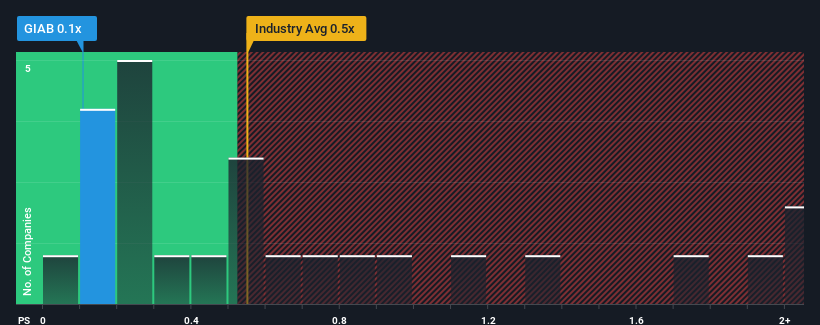
In spite of the firm bounce in price, it's still not a stretch to say that Godsinlösen Nordic's price-to-sales (or "P/S") ratio of 0.1x right now seems quite "middle-of-the-road" compared to the Commercial Services industry in Sweden, where the median P/S ratio is around 0.5x. Although, it's not wise to simply ignore the P/S without explanation as investors may be disregarding a distinct opportunity or a costly mistake.
Check out our latest analysis for Godsinlösen Nordic

How Godsinlösen Nordic Has Been Performing
Godsinlösen Nordic hasn't been tracking well recently as its declining revenue compares poorly to other companies, which have seen some growth in their revenues on average. Perhaps the market is expecting its poor revenue performance to improve, keeping the P/S from dropping. However, if this isn't the case, investors might get caught out paying too much for the stock.
Keen to find out how analysts think Godsinlösen Nordic's future stacks up against the industry? In that case, our free report is a great place to start.What Are Revenue Growth Metrics Telling Us About The P/S?
There's an inherent assumption that a company should be matching the industry for P/S ratios like Godsinlösen Nordic's to be considered reasonable.
Retrospectively, the last year delivered a frustrating 3.1% decrease to the company's top line. This means it has also seen a slide in revenue over the longer-term as revenue is down 24% in total over the last three years. Accordingly, shareholders would have felt downbeat about the medium-term rates of revenue growth.
Looking ahead now, revenue is anticipated to climb by 3.7% per year during the coming three years according to the sole analyst following the company. With the industry predicted to deliver 11% growth each year, the company is positioned for a weaker revenue result.
With this in mind, we find it intriguing that Godsinlösen Nordic's P/S is closely matching its industry peers. Apparently many investors in the company are less bearish than analysts indicate and aren't willing to let go of their stock right now. Maintaining these prices will be difficult to achieve as this level of revenue growth is likely to weigh down the shares eventually.
What Does Godsinlösen Nordic's P/S Mean For Investors?
Godsinlösen Nordic appears to be back in favour with a solid price jump bringing its P/S back in line with other companies in the industry Typically, we'd caution against reading too much into price-to-sales ratios when settling on investment decisions, though it can reveal plenty about what other market participants think about the company.
Our look at the analysts forecasts of Godsinlösen Nordic's revenue prospects has shown that its inferior revenue outlook isn't negatively impacting its P/S as much as we would have predicted. At present, we aren't confident in the P/S as the predicted future revenues aren't likely to support a more positive sentiment for long. A positive change is needed in order to justify the current price-to-sales ratio.
Before you take the next step, you should know about the 4 warning signs for Godsinlösen Nordic (3 are potentially serious!) that we have uncovered.
If these risks are making you reconsider your opinion on Godsinlösen Nordic, explore our interactive list of high quality stocks to get an idea of what else is out there.
New: Manage All Your Stock Portfolios in One Place
We've created the ultimate portfolio companion for stock investors, and it's free.
• Connect an unlimited number of Portfolios and see your total in one currency
• Be alerted to new Warning Signs or Risks via email or mobile
• Track the Fair Value of your stocks
Have feedback on this article? Concerned about the content? Get in touch with us directly. Alternatively, email editorial-team (at) simplywallst.com.
This article by Simply Wall St is general in nature. We provide commentary based on historical data and analyst forecasts only using an unbiased methodology and our articles are not intended to be financial advice. It does not constitute a recommendation to buy or sell any stock, and does not take account of your objectives, or your financial situation. We aim to bring you long-term focused analysis driven by fundamental data. Note that our analysis may not factor in the latest price-sensitive company announcements or qualitative material. Simply Wall St has no position in any stocks mentioned.
About OM:GIAB
Godsinlösen Nordic
Provides various solutions for handling returns and complaints to e-retailers, producers, and distributors in Sweden and internationally.
Undervalued with high growth potential.
Market Insights
Community Narratives


