- Sweden
- /
- Professional Services
- /
- NGM:NOVU
Estimating The Fair Value Of Novus Group International AB (NGM:NOVU)


Key Insights
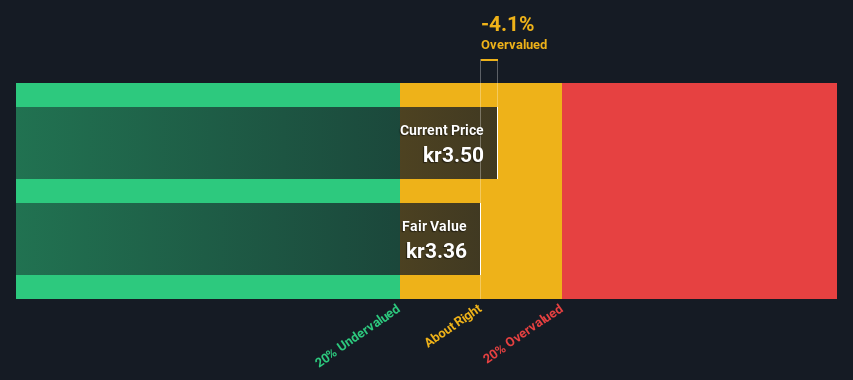
- Using the 2 Stage Free Cash Flow to Equity, Novus Group International fair value estimate is kr3.36
- Current share price of kr3.50 suggests Novus Group International is potentially trading close to its fair value
- The average discount for Novus Group International's competitorsis currently 55%
How far off is Novus Group International AB (NGM:NOVU) from its intrinsic value? Using the most recent financial data, we'll take a look at whether the stock is fairly priced by estimating the company's future cash flows and discounting them to their present value. This will be done using the Discounted Cash Flow (DCF) model. Believe it or not, it's not too difficult to follow, as you'll see from our example!
Companies can be valued in a lot of ways, so we would point out that a DCF is not perfect for every situation. If you want to learn more about discounted cash flow, the rationale behind this calculation can be read in detail in the Simply Wall St analysis model.
View our latest analysis for Novus Group International
Crunching The Numbers
We are going to use a two-stage DCF model, which, as the name states, takes into account two stages of growth. The first stage is generally a higher growth period which levels off heading towards the terminal value, captured in the second 'steady growth' period. In the first stage we need to estimate the cash flows to the business over the next ten years. Seeing as no analyst estimates of free cash flow are available to us, we have extrapolate the previous free cash flow (FCF) from the company's last reported value. We assume companies with shrinking free cash flow will slow their rate of shrinkage, and that companies with growing free cash flow will see their growth rate slow, over this period. We do this to reflect that growth tends to slow more in the early years than it does in later years.
Generally we assume that a dollar today is more valuable than a dollar in the future, so we discount the value of these future cash flows to their estimated value in today's dollars:
10-year free cash flow (FCF) forecast
| 2024 | 2025 | 2026 | 2027 | 2028 | 2029 | 2030 | 2031 | 2032 | 2033 | |
| Levered FCF (SEK, Millions) | kr1.85m | kr1.74m | kr1.68m | kr1.64m | kr1.61m | kr1.60m | kr1.59m | kr1.59m | kr1.60m | kr1.60m |
| Growth Rate Estimate Source | Est @ -8.25% | Est @ -5.58% | Est @ -3.70% | Est @ -2.39% | Est @ -1.47% | Est @ -0.83% | Est @ -0.38% | Est @ -0.06% | Est @ 0.16% | Est @ 0.31% |
| Present Value (SEK, Millions) Discounted @ 5.1% | kr1.8 | kr1.6 | kr1.4 | kr1.3 | kr1.3 | kr1.2 | kr1.1 | kr1.1 | kr1.0 | kr1.0 |
("Est" = FCF growth rate estimated by Simply Wall St)
Present Value of 10-year Cash Flow (PVCF) = kr13m
We now need to calculate the Terminal Value, which accounts for all the future cash flows after this ten year period. For a number of reasons a very conservative growth rate is used that cannot exceed that of a country's GDP growth. In this case we have used the 5-year average of the 10-year government bond yield (0.7%) to estimate future growth. In the same way as with the 10-year 'growth' period, we discount future cash flows to today's value, using a cost of equity of 5.1%.
Terminal Value (TV)= FCF2033 × (1 + g) ÷ (r – g) = kr1.6m× (1 + 0.7%) ÷ (5.1%– 0.7%) = kr36m
Present Value of Terminal Value (PVTV)= TV / (1 + r)10= kr36m÷ ( 1 + 5.1%)10= kr22m
The total value, or equity value, is then the sum of the present value of the future cash flows, which in this case is kr35m. The last step is to then divide the equity value by the number of shares outstanding. Relative to the current share price of kr3.5, the company appears around fair value at the time of writing. The assumptions in any calculation have a big impact on the valuation, so it is better to view this as a rough estimate, not precise down to the last cent.
Important Assumptions
We would point out that the most important inputs to a discounted cash flow are the discount rate and of course the actual cash flows. If you don't agree with these result, have a go at the calculation yourself and play with the assumptions. The DCF also does not consider the possible cyclicality of an industry, or a company's future capital requirements, so it does not give a full picture of a company's potential performance. Given that we are looking at Novus Group International as potential shareholders, the cost of equity is used as the discount rate, rather than the cost of capital (or weighted average cost of capital, WACC) which accounts for debt. In this calculation we've used 5.1%, which is based on a levered beta of 0.886. Beta is a measure of a stock's volatility, compared to the market as a whole. We get our beta from the industry average beta of globally comparable companies, with an imposed limit between 0.8 and 2.0, which is a reasonable range for a stable business.
SWOT Analysis for Novus Group International
- Currently debt free.
- Dividend is in the top 25% of dividend payers in the market.
- Earnings declined over the past year.
- Current share price is above our estimate of fair value.
- NOVU's financial characteristics indicate limited near-term opportunities for shareholders.
- Lack of analyst coverage makes it difficult to determine NOVU's earnings prospects.
- Dividends are not covered by earnings and cashflows.
Moving On:
Although the valuation of a company is important, it ideally won't be the sole piece of analysis you scrutinize for a company. DCF models are not the be-all and end-all of investment valuation. Preferably you'd apply different cases and assumptions and see how they would impact the company's valuation. If a company grows at a different rate, or if its cost of equity or risk free rate changes sharply, the output can look very different. For Novus Group International, we've compiled three important items you should look at:
- Risks: For example, we've discovered 4 warning signs for Novus Group International (3 are a bit concerning!) that you should be aware of before investing here.
- Other Solid Businesses: Low debt, high returns on equity and good past performance are fundamental to a strong business. Why not explore our interactive list of stocks with solid business fundamentals to see if there are other companies you may not have considered!
- Other Top Analyst Picks: Interested to see what the analysts are thinking? Take a look at our interactive list of analysts' top stock picks to find out what they feel might have an attractive future outlook!
PS. Simply Wall St updates its DCF calculation for every Swedish stock every day, so if you want to find the intrinsic value of any other stock just search here.
Valuation is complex, but we're here to simplify it.
Discover if Novus Group International might be undervalued or overvalued with our detailed analysis, featuring fair value estimates, potential risks, dividends, insider trades, and its financial condition.
Access Free AnalysisHave feedback on this article? Concerned about the content? Get in touch with us directly. Alternatively, email editorial-team (at) simplywallst.com.
This article by Simply Wall St is general in nature. We provide commentary based on historical data and analyst forecasts only using an unbiased methodology and our articles are not intended to be financial advice. It does not constitute a recommendation to buy or sell any stock, and does not take account of your objectives, or your financial situation. We aim to bring you long-term focused analysis driven by fundamental data. Note that our analysis may not factor in the latest price-sensitive company announcements or qualitative material. Simply Wall St has no position in any stocks mentioned.
About NGM:NOVU
Novus Group International
Novus Group International AB operates as an analysis and survey company in Sweden.
Flawless balance sheet and good value.
Market Insights

Community Narratives

