Stock Analysis
Those who invested in AB Volvo (STO:VOLV B) five years ago are up 160%

Stock pickers are generally looking for stocks that will outperform the broader market. And in our experience, buying the right stocks can give your wealth a significant boost. For example, long term AB Volvo (publ) (STO:VOLV B) shareholders have enjoyed a 89% share price rise over the last half decade, well in excess of the market return of around 43% (not including dividends). On the other hand, the more recent gains haven't been so impressive, with shareholders gaining just 41% , including dividends .
With that in mind, it's worth seeing if the company's underlying fundamentals have been the driver of long term performance, or if there are some discrepancies.
See our latest analysis for AB Volvo
To paraphrase Benjamin Graham: Over the short term the market is a voting machine, but over the long term it's a weighing machine. One way to examine how market sentiment has changed over time is to look at the interaction between a company's share price and its earnings per share (EPS).
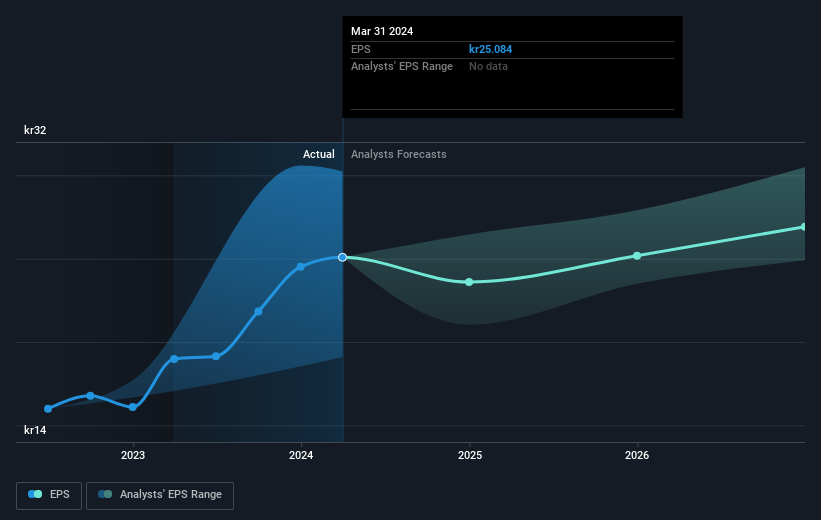
During five years of share price growth, AB Volvo achieved compound earnings per share (EPS) growth of 11% per year. This EPS growth is reasonably close to the 14% average annual increase in the share price. That suggests that the market sentiment around the company hasn't changed much over that time. Indeed, it would appear the share price is reacting to the EPS.
The graphic below depicts how EPS has changed over time (unveil the exact values by clicking on the image).
It's good to see that there was some significant insider buying in the last three months. That's a positive. On the other hand, we think the revenue and earnings trends are much more meaningful measures of the business. Dive deeper into the earnings by checking this interactive graph of AB Volvo's earnings, revenue and cash flow.
What About Dividends?
It is important to consider the total shareholder return, as well as the share price return, for any given stock. The TSR is a return calculation that accounts for the value of cash dividends (assuming that any dividend received was reinvested) and the calculated value of any discounted capital raisings and spin-offs. So for companies that pay a generous dividend, the TSR is often a lot higher than the share price return. In the case of AB Volvo, it has a TSR of 160% for the last 5 years. That exceeds its share price return that we previously mentioned. This is largely a result of its dividend payments!
A Different Perspective
We're pleased to report that AB Volvo shareholders have received a total shareholder return of 41% over one year. Of course, that includes the dividend. That gain is better than the annual TSR over five years, which is 21%. Therefore it seems like sentiment around the company has been positive lately. Given the share price momentum remains strong, it might be worth taking a closer look at the stock, lest you miss an opportunity. It's always interesting to track share price performance over the longer term. But to understand AB Volvo better, we need to consider many other factors. Take risks, for example - AB Volvo has 2 warning signs (and 1 which makes us a bit uncomfortable) we think you should know about.
If you like to buy stocks alongside management, then you might just love this free list of companies. (Hint: insiders have been buying them).
Please note, the market returns quoted in this article reflect the market weighted average returns of stocks that currently trade on Swedish exchanges.
Valuation is complex, but we're helping make it simple.
Find out whether AB Volvo is potentially over or undervalued by checking out our comprehensive analysis, which includes fair value estimates, risks and warnings, dividends, insider transactions and financial health.
View the Free AnalysisHave feedback on this article? Concerned about the content? Get in touch with us directly. Alternatively, email editorial-team (at) simplywallst.com.
This article by Simply Wall St is general in nature. We provide commentary based on historical data and analyst forecasts only using an unbiased methodology and our articles are not intended to be financial advice. It does not constitute a recommendation to buy or sell any stock, and does not take account of your objectives, or your financial situation. We aim to bring you long-term focused analysis driven by fundamental data. Note that our analysis may not factor in the latest price-sensitive company announcements or qualitative material. Simply Wall St has no position in any stocks mentioned.
About OM:VOLV B
AB Volvo
Manufactures and sells trucks, buses, construction equipment, and marine and industrial engines in Europe, the United States, Asia, Africa, and Oceania.
Solid track record, good value and pays a dividend.
