
Advertisement
Key Insights
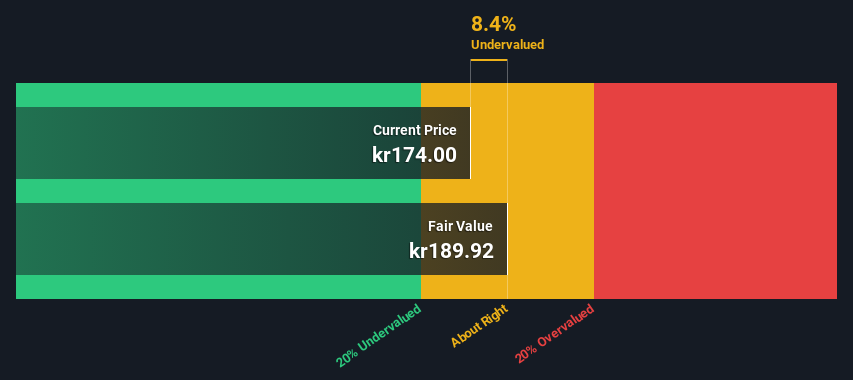
- Sweco's estimated fair value is kr190 based on 2 Stage Free Cash Flow to Equity
- With kr174 share price, Sweco appears to be trading close to its estimated fair value
- Our fair value estimate is 3.7% lower than Sweco's analyst price target of kr197
Today we'll do a simple run through of a valuation method used to estimate the attractiveness of Sweco AB (publ) (STO:SWEC B) as an investment opportunity by taking the forecast future cash flows of the company and discounting them back to today's value. The Discounted Cash Flow (DCF) model is the tool we will apply to do this. Believe it or not, it's not too difficult to follow, as you'll see from our example!
We would caution that there are many ways of valuing a company and, like the DCF, each technique has advantages and disadvantages in certain scenarios. For those who are keen learners of equity analysis, the Simply Wall St analysis model here may be something of interest to you.
Step By Step Through The Calculation
We are going to use a two-stage DCF model, which, as the name states, takes into account two stages of growth. The first stage is generally a higher growth period which levels off heading towards the terminal value, captured in the second 'steady growth' period. To begin with, we have to get estimates of the next ten years of cash flows. Where possible we use analyst estimates, but when these aren't available we extrapolate the previous free cash flow (FCF) from the last estimate or reported value. We assume companies with shrinking free cash flow will slow their rate of shrinkage, and that companies with growing free cash flow will see their growth rate slow, over this period. We do this to reflect that growth tends to slow more in the early years than it does in later years.
Generally we assume that a dollar today is more valuable than a dollar in the future, and so the sum of these future cash flows is then discounted to today's value:
10-year free cash flow (FCF) estimate
| 2025 | 2026 | 2027 | 2028 | 2029 | 2030 | 2031 | 2032 | 2033 | 2034 | |
| Levered FCF (SEK, Millions) | kr2.46b | kr2.88b | kr3.42b | kr3.41b | kr3.41b | kr3.43b | kr3.45b | kr3.48b | kr3.52b | kr3.56b |
| Growth Rate Estimate Source | Analyst x4 | Analyst x4 | Analyst x4 | Est @ -0.34% | Est @ 0.15% | Est @ 0.50% | Est @ 0.74% | Est @ 0.91% | Est @ 1.02% | Est @ 1.11% |
| Present Value (SEK, Millions) Discounted @ 5.9% | kr2.3k | kr2.6k | kr2.9k | kr2.7k | kr2.6k | kr2.4k | kr2.3k | kr2.2k | kr2.1k | kr2.0k |
("Est" = FCF growth rate estimated by Simply Wall St)
Present Value of 10-year Cash Flow (PVCF) = kr24b
We now need to calculate the Terminal Value, which accounts for all the future cash flows after this ten year period. For a number of reasons a very conservative growth rate is used that cannot exceed that of a country's GDP growth. In this case we have used the 5-year average of the 10-year government bond yield (1.3%) to estimate future growth. In the same way as with the 10-year 'growth' period, we discount future cash flows to today's value, using a cost of equity of 5.9%.
Terminal Value (TV)= FCF2034 × (1 + g) ÷ (r – g) = kr3.6b× (1 + 1.3%) ÷ (5.9%– 1.3%) = kr79b
Present Value of Terminal Value (PVTV)= TV / (1 + r)10= kr79b÷ ( 1 + 5.9%)10= kr45b
The total value is the sum of cash flows for the next ten years plus the discounted terminal value, which results in the Total Equity Value, which in this case is kr69b. In the final step we divide the equity value by the number of shares outstanding. Compared to the current share price of kr174, the company appears about fair value at a 8.4% discount to where the stock price trades currently. Remember though, that this is just an approximate valuation, and like any complex formula - garbage in, garbage out.
The Assumptions
The calculation above is very dependent on two assumptions. The first is the discount rate and the other is the cash flows. If you don't agree with these result, have a go at the calculation yourself and play with the assumptions. The DCF also does not consider the possible cyclicality of an industry, or a company's future capital requirements, so it does not give a full picture of a company's potential performance. Given that we are looking at Sweco as potential shareholders, the cost of equity is used as the discount rate, rather than the cost of capital (or weighted average cost of capital, WACC) which accounts for debt. In this calculation we've used 5.9%, which is based on a levered beta of 1.052. Beta is a measure of a stock's volatility, compared to the market as a whole. We get our beta from the industry average beta of globally comparable companies, with an imposed limit between 0.8 and 2.0, which is a reasonable range for a stable business.
Check out our latest analysis for Sweco
SWOT Analysis for Sweco
Strength
- Earnings growth over the past year exceeded the industry.
- Debt is not viewed as a risk.
- Dividends are covered by earnings and cash flows.
Weakness
- Dividend is low compared to the top 25% of dividend payers in the Construction market.
Opportunity
- Annual revenue is forecast to grow faster than the Swedish market.
- Current share price is below our estimate of fair value.
Threat
- Annual earnings are forecast to grow slower than the Swedish market.
Moving On:
Valuation is only one side of the coin in terms of building your investment thesis, and it shouldn't be the only metric you look at when researching a company. The DCF model is not a perfect stock valuation tool. Rather it should be seen as a guide to "what assumptions need to be true for this stock to be under/overvalued?" For instance, if the terminal value growth rate is adjusted slightly, it can dramatically alter the overall result. For Sweco, there are three relevant aspects you should assess:
- Risks: Case in point, we've spotted 2 warning signs for Sweco you should be aware of.
- Management:Have insiders been ramping up their shares to take advantage of the market's sentiment for SWEC B's future outlook? Check out our management and board analysis with insights on CEO compensation and governance factors.
- Other Solid Businesses: Low debt, high returns on equity and good past performance are fundamental to a strong business. Why not explore our interactive list of stocks with solid business fundamentals to see if there are other companies you may not have considered!
PS. The Simply Wall St app conducts a discounted cash flow valuation for every stock on the OM every day. If you want to find the calculation for other stocks just search here.
New: Manage All Your Stock Portfolios in One Place
We've created the ultimate portfolio companion for stock investors, and it's free.
• Connect an unlimited number of Portfolios and see your total in one currency
• Be alerted to new Warning Signs or Risks via email or mobile
• Track the Fair Value of your stocks
Have feedback on this article? Concerned about the content? Get in touch with us directly. Alternatively, email editorial-team (at) simplywallst.com.
This article by Simply Wall St is general in nature. We provide commentary based on historical data and analyst forecasts only using an unbiased methodology and our articles are not intended to be financial advice. It does not constitute a recommendation to buy or sell any stock, and does not take account of your objectives, or your financial situation. We aim to bring you long-term focused analysis driven by fundamental data. Note that our analysis may not factor in the latest price-sensitive company announcements or qualitative material. Simply Wall St has no position in any stocks mentioned.
About OM:SWEC B
Sweco
Provides architecture and engineering consultancy services worldwide.
Flawless balance sheet with solid track record and pays a dividend.
Similar Companies
Market Insights

Advertisement
Community Narratives
The Next Phase of Energy Storage: How NeoVolta Is Tackling America’s Power Crunch
Fair Value US$7.50|35.1% undervalued
MA
Community Contributor
Why EnSilica is Worth Possibly 13x its Current Price
Fair Value UK£5.00|89.8% undervalued
DO
Community Contributor
M&A Activity, Industry Diversification & A Defense Contract Monopoly Will Push BWXT For Healthy Long-Term Growth
Fair Value US$220.00|15.2% undervalued
CL
Community Contributor
A case for Cassiar Gold Corp (TSXV: GLDC) to reach CAD$8-10 before 2030 (X30-37)
Fair Value CA$10.00|96.0% undervalued
AG
Community Contributor