
Advertisement
Slowing Rates Of Return At Svedbergs Group (STO:SVED B) Leave Little Room For Excitement
If you're not sure where to start when looking for the next multi-bagger, there are a few key trends you should keep an eye out for. One common approach is to try and find a company with returns on capital employed (ROCE) that are increasing, in conjunction with a growing amount of capital employed. This shows us that it's a compounding machine, able to continually reinvest its earnings back into the business and generate higher returns. So, when we ran our eye over Svedbergs Group's (STO:SVED B) trend of ROCE, we liked what we saw.
Understanding Return On Capital Employed (ROCE)
For those that aren't sure what ROCE is, it measures the amount of pre-tax profits a company can generate from the capital employed in its business. To calculate this metric for Svedbergs Group, this is the formula:
Return on Capital Employed = Earnings Before Interest and Tax (EBIT) ÷ (Total Assets - Current Liabilities)
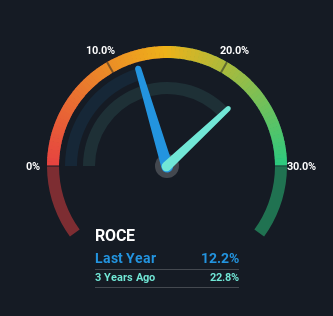
0.12 = kr276m ÷ (kr3.0b - kr787m) (Based on the trailing twelve months to September 2024).
Thus, Svedbergs Group has an ROCE of 12%. That's a pretty standard return and it's in line with the industry average of 12%.
Check out our latest analysis for Svedbergs Group
In the above chart we have measured Svedbergs Group's prior ROCE against its prior performance, but the future is arguably more important. If you're interested, you can view the analysts predictions in our free analyst report for Svedbergs Group .
The Trend Of ROCE
While the current returns on capital are decent, they haven't changed much. Over the past five years, ROCE has remained relatively flat at around 12% and the business has deployed 598% more capital into its operations. 12% is a pretty standard return, and it provides some comfort knowing that Svedbergs Group has consistently earned this amount. Stable returns in this ballpark can be unexciting, but if they can be maintained over the long run, they often provide nice rewards to shareholders.
One more thing to note, even though ROCE has remained relatively flat over the last five years, the reduction in current liabilities to 26% of total assets, is good to see from a business owner's perspective. This can eliminate some of the risks inherent in the operations because the business has less outstanding obligations to their suppliers and or short-term creditors than they did previously.
The Key Takeaway
In the end, Svedbergs Group has proven its ability to adequately reinvest capital at good rates of return. And the stock has done incredibly well with a 200% return over the last five years, so long term investors are no doubt ecstatic with that result. So while the positive underlying trends may be accounted for by investors, we still think this stock is worth looking into further.
If you want to continue researching Svedbergs Group, you might be interested to know about the 1 warning sign that our analysis has discovered.
While Svedbergs Group may not currently earn the highest returns, we've compiled a list of companies that currently earn more than 25% return on equity. Check out this free list here.
New: Manage All Your Stock Portfolios in One Place
We've created the ultimate portfolio companion for stock investors, and it's free.
• Connect an unlimited number of Portfolios and see your total in one currency
• Be alerted to new Warning Signs or Risks via email or mobile
• Track the Fair Value of your stocks
Have feedback on this article? Concerned about the content? Get in touch with us directly. Alternatively, email editorial-team (at) simplywallst.com.
This article by Simply Wall St is general in nature. We provide commentary based on historical data and analyst forecasts only using an unbiased methodology and our articles are not intended to be financial advice. It does not constitute a recommendation to buy or sell any stock, and does not take account of your objectives, or your financial situation. We aim to bring you long-term focused analysis driven by fundamental data. Note that our analysis may not factor in the latest price-sensitive company announcements or qualitative material. Simply Wall St has no position in any stocks mentioned.
About OM:SVED B
Svedbergs Group
Develops, manufactures, and markets bathroom products in the Nordic region, the United Kingdom, and the Netherlands.
Flawless balance sheet and undervalued.
Market Insights

Advertisement
Community Narratives
The Next Phase of Energy Storage: How NeoVolta Is Tackling America’s Power Crunch
Fair Value US$7.50|35.1% undervalued
MA
Community Contributor
Why EnSilica is Worth Possibly 13x its Current Price
Fair Value UK£5.00|89.8% undervalued
DO
Community Contributor
M&A Activity, Industry Diversification & A Defense Contract Monopoly Will Push BWXT For Healthy Long-Term Growth
Fair Value US$220.00|15.2% undervalued
CL
Community Contributor
A case for Cassiar Gold Corp (TSXV: GLDC) to reach CAD$8-10 before 2030 (X30-37)
Fair Value CA$10.00|96.0% undervalued
AG
Community Contributor