

Legendary fund manager Li Lu (who Charlie Munger backed) once said, 'The biggest investment risk is not the volatility of prices, but whether you will suffer a permanent loss of capital.' When we think about how risky a company is, we always like to look at its use of debt, since debt overload can lead to ruin. As with many other companies SolTech Energy Sweden AB (publ) (STO:SOLT) makes use of debt. But the real question is whether this debt is making the company risky.
When Is Debt A Problem?
Debt and other liabilities become risky for a business when it cannot easily fulfill those obligations, either with free cash flow or by raising capital at an attractive price. Part and parcel of capitalism is the process of 'creative destruction' where failed businesses are mercilessly liquidated by their bankers. While that is not too common, we often do see indebted companies permanently diluting shareholders because lenders force them to raise capital at a distressed price. Having said that, the most common situation is where a company manages its debt reasonably well - and to its own advantage. The first step when considering a company's debt levels is to consider its cash and debt together.
See our latest analysis for SolTech Energy Sweden
How Much Debt Does SolTech Energy Sweden Carry?
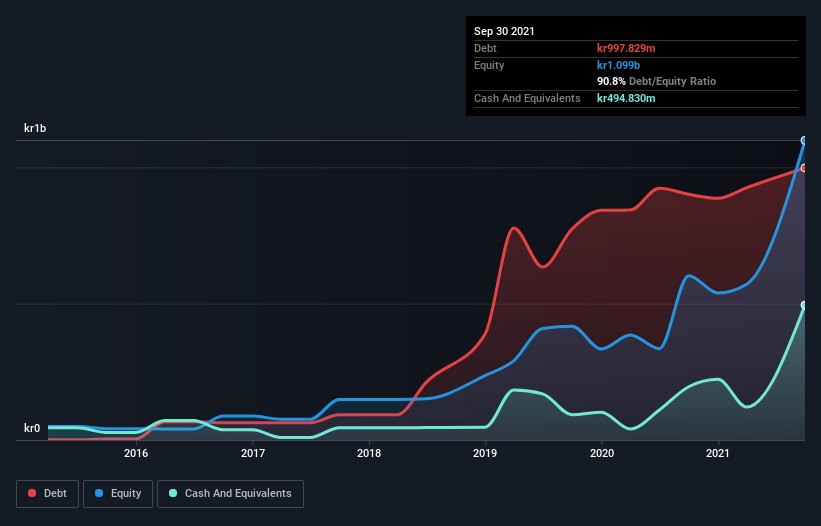
As you can see below, at the end of September 2021, SolTech Energy Sweden had kr997.8m of debt, up from kr901.0m a year ago. Click the image for more detail. However, because it has a cash reserve of kr494.8m, its net debt is less, at about kr503.0m.
How Strong Is SolTech Energy Sweden's Balance Sheet?
Zooming in on the latest balance sheet data, we can see that SolTech Energy Sweden had liabilities of kr347.4m due within 12 months and liabilities of kr1.20b due beyond that. On the other hand, it had cash of kr494.8m and kr270.9m worth of receivables due within a year. So its liabilities total kr783.4m more than the combination of its cash and short-term receivables.
SolTech Energy Sweden has a market capitalization of kr1.78b, so it could very likely raise cash to ameliorate its balance sheet, if the need arose. But we definitely want to keep our eyes open to indications that its debt is bringing too much risk. When analysing debt levels, the balance sheet is the obvious place to start. But you can't view debt in total isolation; since SolTech Energy Sweden will need earnings to service that debt. So when considering debt, it's definitely worth looking at the earnings trend. Click here for an interactive snapshot.
In the last year SolTech Energy Sweden wasn't profitable at an EBIT level, but managed to grow its revenue by 144%, to kr785m. So there's no doubt that shareholders are cheering for growth
Caveat Emptor
Despite the top line growth, SolTech Energy Sweden still had an earnings before interest and tax (EBIT) loss over the last year. To be specific the EBIT loss came in at kr17m. When we look at that and recall the liabilities on its balance sheet, relative to cash, it seems unwise to us for the company to have any debt. So we think its balance sheet is a little strained, though not beyond repair. However, it doesn't help that it burned through kr313m of cash over the last year. So suffice it to say we consider the stock very risky. When analysing debt levels, the balance sheet is the obvious place to start. But ultimately, every company can contain risks that exist outside of the balance sheet. To that end, you should learn about the 4 warning signs we've spotted with SolTech Energy Sweden (including 2 which shouldn't be ignored) .
If, after all that, you're more interested in a fast growing company with a rock-solid balance sheet, then check out our list of net cash growth stocks without delay.
New: Manage All Your Stock Portfolios in One Place
We've created the ultimate portfolio companion for stock investors, and it's free.
• Connect an unlimited number of Portfolios and see your total in one currency
• Be alerted to new Warning Signs or Risks via email or mobile
• Track the Fair Value of your stocks
Have feedback on this article? Concerned about the content? Get in touch with us directly. Alternatively, email editorial-team (at) simplywallst.com.
This article by Simply Wall St is general in nature. We provide commentary based on historical data and analyst forecasts only using an unbiased methodology and our articles are not intended to be financial advice. It does not constitute a recommendation to buy or sell any stock, and does not take account of your objectives, or your financial situation. We aim to bring you long-term focused analysis driven by fundamental data. Note that our analysis may not factor in the latest price-sensitive company announcements or qualitative material. Simply Wall St has no position in any stocks mentioned.
About OM:SOLT
SolTech Energy Sweden
Develops, sells, and installs energy and solar cell solutions in Sweden and China.
Flawless balance sheet and good value.
Market Insights

Community Narratives

