
Advertisement
An Intrinsic Calculation For AB SKF (publ) (STO:SKF B) Suggests It's 40% Undervalued
Key Insights
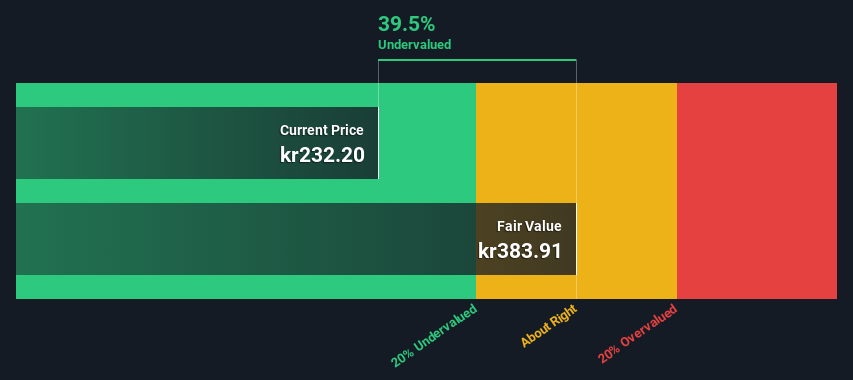
- Using the 2 Stage Free Cash Flow to Equity, AB SKF fair value estimate is kr384
- Current share price of kr232 suggests AB SKF is potentially 40% undervalued
- Analyst price target for SKF B is kr246 which is 36% below our fair value estimate
In this article we are going to estimate the intrinsic value of AB SKF (publ) (STO:SKF B) by taking the forecast future cash flows of the company and discounting them back to today's value. Our analysis will employ the Discounted Cash Flow (DCF) model. Believe it or not, it's not too difficult to follow, as you'll see from our example!
Companies can be valued in a lot of ways, so we would point out that a DCF is not perfect for every situation. Anyone interested in learning a bit more about intrinsic value should have a read of the Simply Wall St analysis model.
View our latest analysis for AB SKF
Crunching The Numbers
We're using the 2-stage growth model, which simply means we take in account two stages of company's growth. In the initial period the company may have a higher growth rate and the second stage is usually assumed to have a stable growth rate. To begin with, we have to get estimates of the next ten years of cash flows. Where possible we use analyst estimates, but when these aren't available we extrapolate the previous free cash flow (FCF) from the last estimate or reported value. We assume companies with shrinking free cash flow will slow their rate of shrinkage, and that companies with growing free cash flow will see their growth rate slow, over this period. We do this to reflect that growth tends to slow more in the early years than it does in later years.
Generally we assume that a dollar today is more valuable than a dollar in the future, and so the sum of these future cash flows is then discounted to today's value:
10-year free cash flow (FCF) forecast
| 2025 | 2026 | 2027 | 2028 | 2029 | 2030 | 2031 | 2032 | 2033 | 2034 | |
| Levered FCF (SEK, Millions) | kr7.80b | kr8.95b | kr9.03b | kr8.99b | kr9.01b | kr9.05b | kr9.12b | kr9.20b | kr9.29b | kr9.39b |
| Growth Rate Estimate Source | Analyst x8 | Analyst x8 | Analyst x4 | Analyst x1 | Est @ 0.14% | Est @ 0.49% | Est @ 0.73% | Est @ 0.90% | Est @ 1.02% | Est @ 1.10% |
| Present Value (SEK, Millions) Discounted @ 6.1% | kr7.3k | kr7.9k | kr7.6k | kr7.1k | kr6.7k | kr6.3k | kr6.0k | kr5.7k | kr5.4k | kr5.2k |
("Est" = FCF growth rate estimated by Simply Wall St)
Present Value of 10-year Cash Flow (PVCF) = kr65b
We now need to calculate the Terminal Value, which accounts for all the future cash flows after this ten year period. The Gordon Growth formula is used to calculate Terminal Value at a future annual growth rate equal to the 5-year average of the 10-year government bond yield of 1.3%. We discount the terminal cash flows to today's value at a cost of equity of 6.1%.
Terminal Value (TV)= FCF2034 × (1 + g) ÷ (r – g) = kr9.4b× (1 + 1.3%) ÷ (6.1%– 1.3%) = kr198b
Present Value of Terminal Value (PVTV)= TV / (1 + r)10= kr198b÷ ( 1 + 6.1%)10= kr109b
The total value is the sum of cash flows for the next ten years plus the discounted terminal value, which results in the Total Equity Value, which in this case is kr175b. In the final step we divide the equity value by the number of shares outstanding. Relative to the current share price of kr232, the company appears quite good value at a 40% discount to where the stock price trades currently. The assumptions in any calculation have a big impact on the valuation, so it is better to view this as a rough estimate, not precise down to the last cent.
Important Assumptions
The calculation above is very dependent on two assumptions. The first is the discount rate and the other is the cash flows. If you don't agree with these result, have a go at the calculation yourself and play with the assumptions. The DCF also does not consider the possible cyclicality of an industry, or a company's future capital requirements, so it does not give a full picture of a company's potential performance. Given that we are looking at AB SKF as potential shareholders, the cost of equity is used as the discount rate, rather than the cost of capital (or weighted average cost of capital, WACC) which accounts for debt. In this calculation we've used 6.1%, which is based on a levered beta of 1.110. Beta is a measure of a stock's volatility, compared to the market as a whole. We get our beta from the industry average beta of globally comparable companies, with an imposed limit between 0.8 and 2.0, which is a reasonable range for a stable business.
SWOT Analysis for AB SKF
Strength
- Earnings growth over the past year exceeded the industry.
- Debt is not viewed as a risk.
- Dividends are covered by earnings and cash flows.
Weakness
- Earnings growth over the past year is below its 5-year average.
- Dividend is low compared to the top 25% of dividend payers in the Machinery market.
Opportunity
- Annual earnings are forecast to grow faster than the Swedish market.
- Good value based on P/E ratio and estimated fair value.
Threat
- Revenue is forecast to grow slower than 20% per year.
Looking Ahead:
Although the valuation of a company is important, it is only one of many factors that you need to assess for a company. The DCF model is not a perfect stock valuation tool. Instead the best use for a DCF model is to test certain assumptions and theories to see if they would lead to the company being undervalued or overvalued. If a company grows at a different rate, or if its cost of equity or risk free rate changes sharply, the output can look very different. Why is the intrinsic value higher than the current share price? For AB SKF, we've put together three fundamental factors you should consider:
- Risks: Every company has them, and we've spotted 1 warning sign for AB SKF you should know about.
- Future Earnings: How does SKF B's growth rate compare to its peers and the wider market? Dig deeper into the analyst consensus number for the upcoming years by interacting with our free analyst growth expectation chart.
- Other High Quality Alternatives: Do you like a good all-rounder? Explore our interactive list of high quality stocks to get an idea of what else is out there you may be missing!
PS. The Simply Wall St app conducts a discounted cash flow valuation for every stock on the OM every day. If you want to find the calculation for other stocks just search here.
New: Manage All Your Stock Portfolios in One Place
We've created the ultimate portfolio companion for stock investors, and it's free.
• Connect an unlimited number of Portfolios and see your total in one currency
• Be alerted to new Warning Signs or Risks via email or mobile
• Track the Fair Value of your stocks
Have feedback on this article? Concerned about the content? Get in touch with us directly. Alternatively, email editorial-team (at) simplywallst.com.
This article by Simply Wall St is general in nature. We provide commentary based on historical data and analyst forecasts only using an unbiased methodology and our articles are not intended to be financial advice. It does not constitute a recommendation to buy or sell any stock, and does not take account of your objectives, or your financial situation. We aim to bring you long-term focused analysis driven by fundamental data. Note that our analysis may not factor in the latest price-sensitive company announcements or qualitative material. Simply Wall St has no position in any stocks mentioned.
About OM:SKF B
AB SKF
Designs, manufactures, and sells bearings and units, seals, lubrication systems, condition monitoring, and services worldwide.
Flawless balance sheet, undervalued and pays a dividend.
Similar Companies
Market Insights

Advertisement
Community Narratives
Quality at a Premium. A time to watch, not to buy?
Fair Value US$154.56|27.6% undervalued
DA
Community Contributor
GRAB: The Super-App at the Heart of Southeast Asia’s Digital Boom
Fair Value US$8.20|22.1% undervalued
BL
Community Contributor
Verve Group to Surge with 51.61% Revenue Growth
Fair Value €6.00|60.0% undervalued
ME
Community Contributor