- Sweden
- /
- Trade Distributors
- /
- OM:OEM B
Are Robust Financials Driving The Recent Rally In OEM International AB (publ)'s (STO:OEM B) Stock?


OEM International's (STO:OEM B) stock is up by a considerable 27% over the past month. Since the market usually pay for a company’s long-term fundamentals, we decided to study the company’s key performance indicators to see if they could be influencing the market. Specifically, we decided to study OEM International's ROE in this article.
ROE or return on equity is a useful tool to assess how effectively a company can generate returns on the investment it received from its shareholders. In other words, it is a profitability ratio which measures the rate of return on the capital provided by the company's shareholders.
See our latest analysis for OEM International
How To Calculate Return On Equity?
Return on equity can be calculated by using the formula:
Return on Equity = Net Profit (from continuing operations) ÷ Shareholders' Equity
So, based on the above formula, the ROE for OEM International is:
33% = kr617m ÷ kr1.9b (Based on the trailing twelve months to September 2023).
The 'return' is the yearly profit. So, this means that for every SEK1 of its shareholder's investments, the company generates a profit of SEK0.33.
Why Is ROE Important For Earnings Growth?
So far, we've learned that ROE is a measure of a company's profitability. Depending on how much of these profits the company reinvests or "retains", and how effectively it does so, we are then able to assess a company’s earnings growth potential. Generally speaking, other things being equal, firms with a high return on equity and profit retention, have a higher growth rate than firms that don’t share these attributes.
OEM International's Earnings Growth And 33% ROE
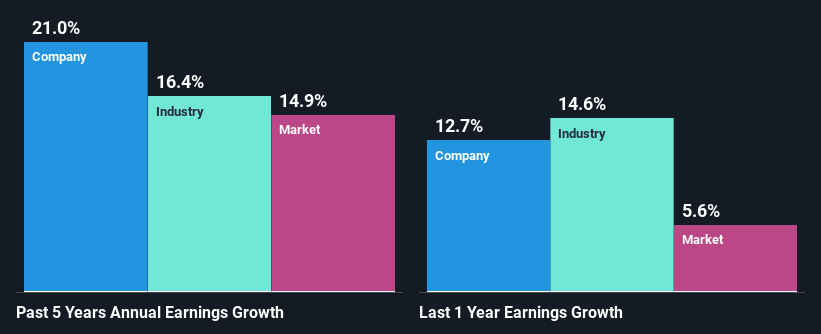
Firstly, we acknowledge that OEM International has a significantly high ROE. Second, a comparison with the average ROE reported by the industry of 14% also doesn't go unnoticed by us. Under the circumstances, OEM International's considerable five year net income growth of 21% was to be expected.
Next, on comparing with the industry net income growth, we found that OEM International's growth is quite high when compared to the industry average growth of 16% in the same period, which is great to see.
The basis for attaching value to a company is, to a great extent, tied to its earnings growth. The investor should try to establish if the expected growth or decline in earnings, whichever the case may be, is priced in. This then helps them determine if the stock is placed for a bright or bleak future. If you're wondering about OEM International's's valuation, check out this gauge of its price-to-earnings ratio, as compared to its industry.
Is OEM International Using Its Retained Earnings Effectively?
OEM International's three-year median payout ratio is a pretty moderate 37%, meaning the company retains 63% of its income. This suggests that its dividend is well covered, and given the high growth we discussed above, it looks like OEM International is reinvesting its earnings efficiently.
Besides, OEM International has been paying dividends for at least ten years or more. This shows that the company is committed to sharing profits with its shareholders.
Summary
Overall, we are quite pleased with OEM International's performance. Particularly, we like that the company is reinvesting heavily into its business, and at a high rate of return. Unsurprisingly, this has led to an impressive earnings growth.
New: AI Stock Screener & Alerts
Our new AI Stock Screener scans the market every day to uncover opportunities.
• Dividend Powerhouses (3%+ Yield)
• Undervalued Small Caps with Insider Buying
• High growth Tech and AI Companies
Or build your own from over 50 metrics.
Have feedback on this article? Concerned about the content? Get in touch with us directly. Alternatively, email editorial-team (at) simplywallst.com.
This article by Simply Wall St is general in nature. We provide commentary based on historical data and analyst forecasts only using an unbiased methodology and our articles are not intended to be financial advice. It does not constitute a recommendation to buy or sell any stock, and does not take account of your objectives, or your financial situation. We aim to bring you long-term focused analysis driven by fundamental data. Note that our analysis may not factor in the latest price-sensitive company announcements or qualitative material. Simply Wall St has no position in any stocks mentioned.
About OM:OEM B
OEM International
Provides products and systems for industrial applications.
Flawless balance sheet average dividend payer.
