
Advertisement
Warren Buffett famously said, 'Volatility is far from synonymous with risk.' When we think about how risky a company is, we always like to look at its use of debt, since debt overload can lead to ruin. As with many other companies NCC AB (publ) (STO:NCC B) makes use of debt. But the more important question is: how much risk is that debt creating?
Why Does Debt Bring Risk?
Debt and other liabilities become risky for a business when it cannot easily fulfill those obligations, either with free cash flow or by raising capital at an attractive price. In the worst case scenario, a company can go bankrupt if it cannot pay its creditors. However, a more common (but still painful) scenario is that it has to raise new equity capital at a low price, thus permanently diluting shareholders. Having said that, the most common situation is where a company manages its debt reasonably well - and to its own advantage. The first thing to do when considering how much debt a business uses is to look at its cash and debt together.
Check out our latest analysis for NCC
What Is NCC's Net Debt?
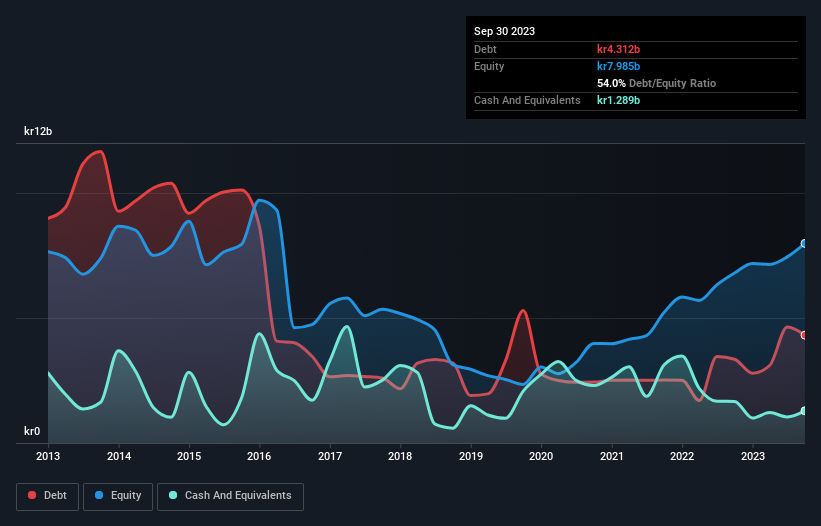
The image below, which you can click on for greater detail, shows that at September 2023 NCC had debt of kr4.31b, up from kr3.35b in one year. However, because it has a cash reserve of kr1.29b, its net debt is less, at about kr3.02b.
How Strong Is NCC's Balance Sheet?
Zooming in on the latest balance sheet data, we can see that NCC had liabilities of kr19.4b due within 12 months and liabilities of kr6.57b due beyond that. Offsetting this, it had kr1.29b in cash and kr13.2b in receivables that were due within 12 months. So its liabilities total kr11.5b more than the combination of its cash and short-term receivables.
This deficit is considerable relative to its market capitalization of kr11.7b, so it does suggest shareholders should keep an eye on NCC's use of debt. Should its lenders demand that it shore up the balance sheet, shareholders would likely face severe dilution.
We measure a company's debt load relative to its earnings power by looking at its net debt divided by its earnings before interest, tax, depreciation, and amortization (EBITDA) and by calculating how easily its earnings before interest and tax (EBIT) cover its interest expense (interest cover). This way, we consider both the absolute quantum of the debt, as well as the interest rates paid on it.
NCC has a low net debt to EBITDA ratio of only 1.3. And its EBIT covers its interest expense a whopping 96.8 times over. So we're pretty relaxed about its super-conservative use of debt. Another good sign is that NCC has been able to increase its EBIT by 26% in twelve months, making it easier to pay down debt. There's no doubt that we learn most about debt from the balance sheet. But it is future earnings, more than anything, that will determine NCC's ability to maintain a healthy balance sheet going forward. So if you're focused on the future you can check out this free report showing analyst profit forecasts.
Finally, a business needs free cash flow to pay off debt; accounting profits just don't cut it. So we clearly need to look at whether that EBIT is leading to corresponding free cash flow. Over the last three years, NCC reported free cash flow worth 14% of its EBIT, which is really quite low. That limp level of cash conversion undermines its ability to manage and pay down debt.
Our View
NCC's interest cover was a real positive on this analysis, as was its EBIT growth rate. On the other hand, its level of total liabilities makes us a little less comfortable about its debt. Looking at all this data makes us feel a little cautious about NCC's debt levels. While we appreciate debt can enhance returns on equity, we'd suggest that shareholders keep close watch on its debt levels, lest they increase. When analysing debt levels, the balance sheet is the obvious place to start. However, not all investment risk resides within the balance sheet - far from it. For example NCC has 2 warning signs (and 1 which is a bit concerning) we think you should know about.
Of course, if you're the type of investor who prefers buying stocks without the burden of debt, then don't hesitate to discover our exclusive list of net cash growth stocks, today.
Valuation is complex, but we're here to simplify it.
Discover if NCC might be undervalued or overvalued with our detailed analysis, featuring fair value estimates, potential risks, dividends, insider trades, and its financial condition.
Access Free AnalysisHave feedback on this article? Concerned about the content? Get in touch with us directly. Alternatively, email editorial-team (at) simplywallst.com.
This article by Simply Wall St is general in nature. We provide commentary based on historical data and analyst forecasts only using an unbiased methodology and our articles are not intended to be financial advice. It does not constitute a recommendation to buy or sell any stock, and does not take account of your objectives, or your financial situation. We aim to bring you long-term focused analysis driven by fundamental data. Note that our analysis may not factor in the latest price-sensitive company announcements or qualitative material. Simply Wall St has no position in any stocks mentioned.
About OM:NCC B
NCC
Operates as a construction company in Sweden, Norway, Denmark, and Finland.
Flawless balance sheet, undervalued and pays a dividend.
Similar Companies
Market Insights

Advertisement
Community Narratives
The Next Phase of Energy Storage: How NeoVolta Is Tackling America’s Power Crunch
Fair Value US$7.50|35.1% undervalued
MA
Community Contributor
Why EnSilica is Worth Possibly 13x its Current Price
Fair Value UK£5.00|89.8% undervalued
DO
Community Contributor
M&A Activity, Industry Diversification & A Defense Contract Monopoly Will Push BWXT For Healthy Long-Term Growth
Fair Value US$220.00|15.2% undervalued
CL
Community Contributor
A case for Cassiar Gold Corp (TSXV: GLDC) to reach CAD$8-10 before 2030 (X30-37)
Fair Value CA$10.00|96.0% undervalued
AG
Community Contributor