
Advertisement
- Sweden
- /
- Trade Distributors
- /
- OM:MMGR B
Does This Valuation Of Momentum Group AB (publ) (STO:MMGR B) Imply Investors Are Overpaying?
Key Insights
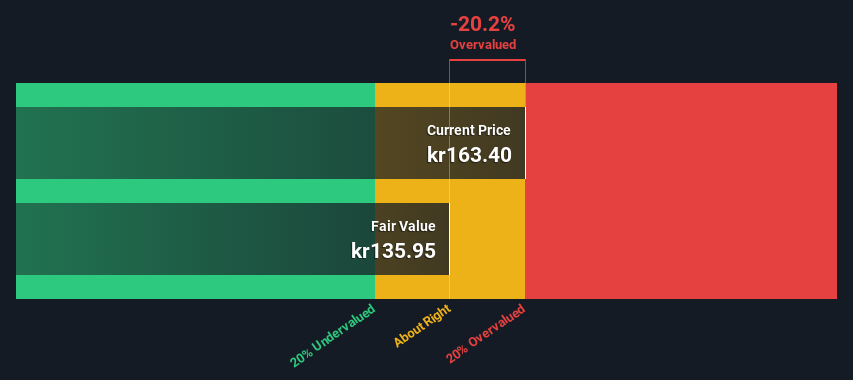
- The projected fair value for Momentum Group is kr136 based on 2 Stage Free Cash Flow to Equity
- Momentum Group is estimated to be 20% overvalued based on current share price of kr163
- When compared to theindustry average discount of -31%, Momentum Group's competitors seem to be trading at a greater premium to fair value
Today we'll do a simple run through of a valuation method used to estimate the attractiveness of Momentum Group AB (publ) (STO:MMGR B) as an investment opportunity by taking the forecast future cash flows of the company and discounting them back to today's value. Our analysis will employ the Discounted Cash Flow (DCF) model. Believe it or not, it's not too difficult to follow, as you'll see from our example!
Companies can be valued in a lot of ways, so we would point out that a DCF is not perfect for every situation. If you want to learn more about discounted cash flow, the rationale behind this calculation can be read in detail in the Simply Wall St analysis model.
See our latest analysis for Momentum Group
Is Momentum Group Fairly Valued?
We use what is known as a 2-stage model, which simply means we have two different periods of growth rates for the company's cash flows. Generally the first stage is higher growth, and the second stage is a lower growth phase. To begin with, we have to get estimates of the next ten years of cash flows. Where possible we use analyst estimates, but when these aren't available we extrapolate the previous free cash flow (FCF) from the last estimate or reported value. We assume companies with shrinking free cash flow will slow their rate of shrinkage, and that companies with growing free cash flow will see their growth rate slow, over this period. We do this to reflect that growth tends to slow more in the early years than it does in later years.
Generally we assume that a dollar today is more valuable than a dollar in the future, and so the sum of these future cash flows is then discounted to today's value:
10-year free cash flow (FCF) forecast
| 2024 | 2025 | 2026 | 2027 | 2028 | 2029 | 2030 | 2031 | 2032 | 2033 | |
| Levered FCF (SEK, Millions) | kr242.0m | kr261.5m | kr309.5m | kr327.5m | kr341.9m | kr353.3m | kr362.6m | kr370.4m | kr377.0m | kr382.8m |
| Growth Rate Estimate Source | Analyst x1 | Analyst x2 | Analyst x2 | Est @ 5.83% | Est @ 4.37% | Est @ 3.35% | Est @ 2.64% | Est @ 2.14% | Est @ 1.79% | Est @ 1.54% |
| Present Value (SEK, Millions) Discounted @ 6.0% | kr228 | kr233 | kr260 | kr260 | kr256 | kr249 | kr242 | kr233 | kr224 | kr214 |
("Est" = FCF growth rate estimated by Simply Wall St)
Present Value of 10-year Cash Flow (PVCF) = kr2.4b
After calculating the present value of future cash flows in the initial 10-year period, we need to calculate the Terminal Value, which accounts for all future cash flows beyond the first stage. For a number of reasons a very conservative growth rate is used that cannot exceed that of a country's GDP growth. In this case we have used the 5-year average of the 10-year government bond yield (1.0%) to estimate future growth. In the same way as with the 10-year 'growth' period, we discount future cash flows to today's value, using a cost of equity of 6.0%.
Terminal Value (TV)= FCF2033 × (1 + g) ÷ (r – g) = kr383m× (1 + 1.0%) ÷ (6.0%– 1.0%) = kr7.7b
Present Value of Terminal Value (PVTV)= TV / (1 + r)10= kr7.7b÷ ( 1 + 6.0%)10= kr4.3b
The total value is the sum of cash flows for the next ten years plus the discounted terminal value, which results in the Total Equity Value, which in this case is kr6.7b. The last step is to then divide the equity value by the number of shares outstanding. Relative to the current share price of kr163, the company appears slightly overvalued at the time of writing. The assumptions in any calculation have a big impact on the valuation, so it is better to view this as a rough estimate, not precise down to the last cent.
Important Assumptions
The calculation above is very dependent on two assumptions. The first is the discount rate and the other is the cash flows. Part of investing is coming up with your own evaluation of a company's future performance, so try the calculation yourself and check your own assumptions. The DCF also does not consider the possible cyclicality of an industry, or a company's future capital requirements, so it does not give a full picture of a company's potential performance. Given that we are looking at Momentum Group as potential shareholders, the cost of equity is used as the discount rate, rather than the cost of capital (or weighted average cost of capital, WACC) which accounts for debt. In this calculation we've used 6.0%, which is based on a levered beta of 1.089. Beta is a measure of a stock's volatility, compared to the market as a whole. We get our beta from the industry average beta of globally comparable companies, with an imposed limit between 0.8 and 2.0, which is a reasonable range for a stable business.
SWOT Analysis for Momentum Group
Strength
- Earnings growth over the past year exceeded the industry.
- Debt is well covered by earnings and cashflows.
Weakness
- Earnings growth over the past year is below its 5-year average.
- Dividend is low compared to the top 25% of dividend payers in the Trade Distributors market.
- Expensive based on P/E ratio and estimated fair value.
Opportunity
- Annual revenue is forecast to grow faster than the Swedish market.
Threat
- No apparent threats visible for MMGR B.
Next Steps:
Although the valuation of a company is important, it ideally won't be the sole piece of analysis you scrutinize for a company. The DCF model is not a perfect stock valuation tool. Rather it should be seen as a guide to "what assumptions need to be true for this stock to be under/overvalued?" If a company grows at a different rate, or if its cost of equity or risk free rate changes sharply, the output can look very different. Can we work out why the company is trading at a premium to intrinsic value? For Momentum Group, we've compiled three relevant aspects you should look at:
- Risks: Consider for instance, the ever-present spectre of investment risk. We've identified 1 warning sign with Momentum Group , and understanding this should be part of your investment process.
- Future Earnings: How does MMGR B's growth rate compare to its peers and the wider market? Dig deeper into the analyst consensus number for the upcoming years by interacting with our free analyst growth expectation chart.
- Other Solid Businesses: Low debt, high returns on equity and good past performance are fundamental to a strong business. Why not explore our interactive list of stocks with solid business fundamentals to see if there are other companies you may not have considered!
PS. Simply Wall St updates its DCF calculation for every Swedish stock every day, so if you want to find the intrinsic value of any other stock just search here.
New: Manage All Your Stock Portfolios in One Place
We've created the ultimate portfolio companion for stock investors, and it's free.
• Connect an unlimited number of Portfolios and see your total in one currency
• Be alerted to new Warning Signs or Risks via email or mobile
• Track the Fair Value of your stocks
Have feedback on this article? Concerned about the content? Get in touch with us directly. Alternatively, email editorial-team (at) simplywallst.com.
This article by Simply Wall St is general in nature. We provide commentary based on historical data and analyst forecasts only using an unbiased methodology and our articles are not intended to be financial advice. It does not constitute a recommendation to buy or sell any stock, and does not take account of your objectives, or your financial situation. We aim to bring you long-term focused analysis driven by fundamental data. Note that our analysis may not factor in the latest price-sensitive company announcements or qualitative material. Simply Wall St has no position in any stocks mentioned.
About OM:MMGR B
Momentum Group
Supplies industrial components, industrial services, and related services to the industrial sector in Sweden, Norway, Denmark, Finland, and internationally.
Reasonable growth potential with adequate balance sheet.
Market Insights

Advertisement
Community Narratives
The company that turned a verb into a global necessity and basically runs the modern internet, digital ads, smartphones, maps, and AI.
Fair Value US$300.00|8.5% undervalued
OS
Community Contributor
Flowers Foods Pays A Fair Price For Health
Fair Value US$16.12|24.6% undervalued
NV
Community Contributor
TMX Group will thrive with 33.3% profit margin and enduring market moat
Fair Value CA$49.90|0.1% undervalued
LI
Community Contributor