It's Down 25% But Lyckegård Group AB (publ) (STO:LYGRD) Could Be Riskier Than It Looks

The Lyckegård Group AB (publ) (STO:LYGRD) share price has softened a substantial 25% over the previous 30 days, handing back much of the gains the stock has made lately. The good news is that in the last year, the stock has shone bright like a diamond, gaining 137%.
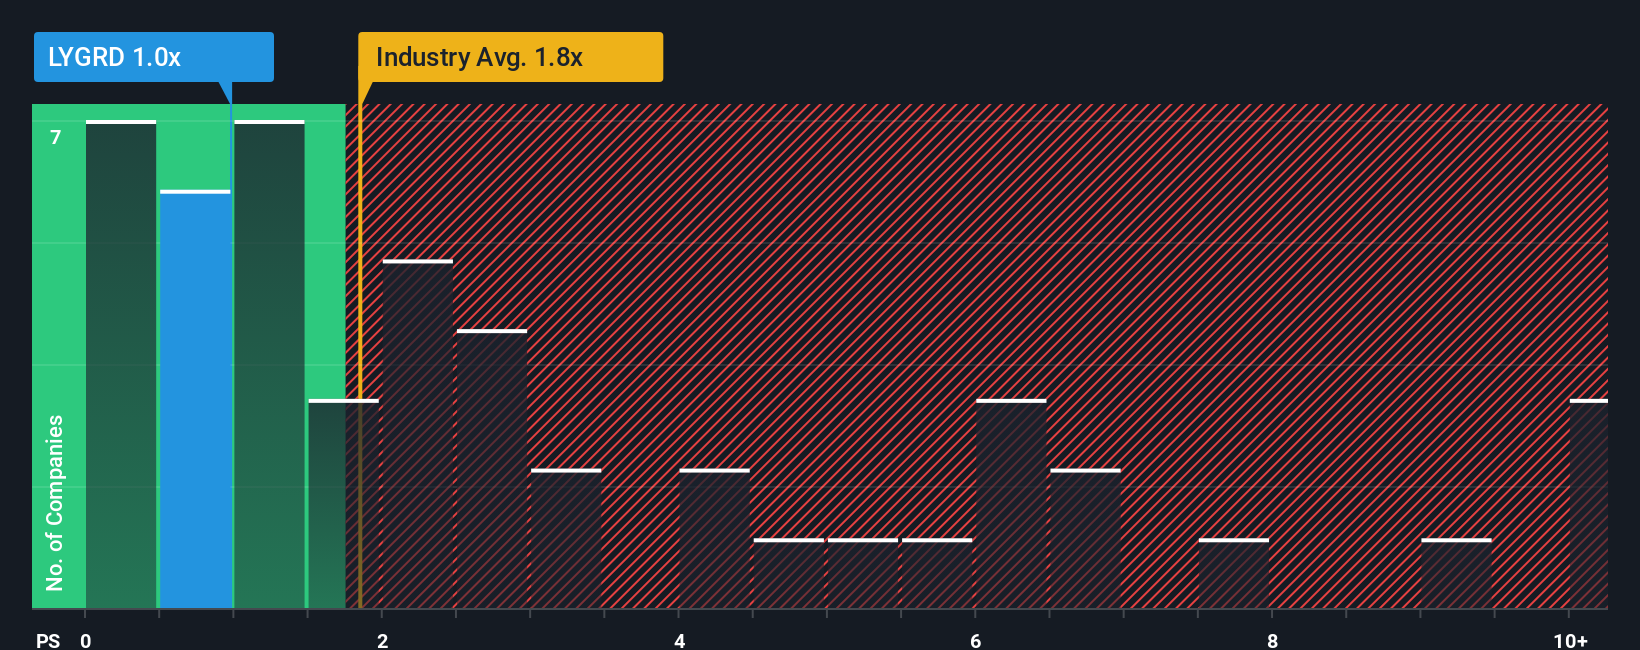
Since its price has dipped substantially, Lyckegård Group may be sending buy signals at present with its price-to-sales (or "P/S") ratio of 1x, considering almost half of all companies in the Machinery industry in Sweden have P/S ratios greater than 1.8x and even P/S higher than 5x aren't out of the ordinary. However, the P/S might be low for a reason and it requires further investigation to determine if it's justified.
Check out our latest analysis for Lyckegård Group
How Lyckegård Group Has Been Performing
For instance, Lyckegård Group's receding revenue in recent times would have to be some food for thought. One possibility is that the P/S is low because investors think the company won't do enough to avoid underperforming the broader industry in the near future. If you like the company, you'd be hoping this isn't the case so that you could potentially pick up some stock while it's out of favour.
Although there are no analyst estimates available for Lyckegård Group, take a look at this free data-rich visualisation to see how the company stacks up on earnings, revenue and cash flow.Do Revenue Forecasts Match The Low P/S Ratio?
Lyckegård Group's P/S ratio would be typical for a company that's only expected to deliver limited growth, and importantly, perform worse than the industry.
In reviewing the last year of financials, we were disheartened to see the company's revenues fell to the tune of 4.0%. The latest three year period has seen an incredible overall rise in revenue, a stark contrast to the last 12 months. Therefore, it's fair to say the revenue growth recently has been superb for the company, but investors will want to ask why it is now in decline.
This is in contrast to the rest of the industry, which is expected to grow by 1.3% over the next year, materially lower than the company's recent medium-term annualised growth rates.
With this in mind, we find it intriguing that Lyckegård Group's P/S isn't as high compared to that of its industry peers. It looks like most investors are not convinced the company can maintain its recent growth rates.
What We Can Learn From Lyckegård Group's P/S?
Lyckegård Group's recently weak share price has pulled its P/S back below other Machinery companies. It's argued the price-to-sales ratio is an inferior measure of value within certain industries, but it can be a powerful business sentiment indicator.
Our examination of Lyckegård Group revealed its three-year revenue trends aren't boosting its P/S anywhere near as much as we would have predicted, given they look better than current industry expectations. When we see robust revenue growth that outpaces the industry, we presume that there are notable underlying risks to the company's future performance, which is exerting downward pressure on the P/S ratio. It appears many are indeed anticipating revenue instability, because the persistence of these recent medium-term conditions would normally provide a boost to the share price.
It's always necessary to consider the ever-present spectre of investment risk. We've identified 5 warning signs with Lyckegård Group (at least 3 which are potentially serious), and understanding these should be part of your investment process.
If strong companies turning a profit tickle your fancy, then you'll want to check out this free list of interesting companies that trade on a low P/E (but have proven they can grow earnings).
The New Payments ETF Is Live on NASDAQ:
Money is moving to real-time rails, and a newly listed ETF now gives investors direct exposure. Fast settlement. Institutional custody. Simple access.
Explore how this launch could reshape portfolios
Sponsored ContentNew: AI Stock Screener & Alerts
Our new AI Stock Screener scans the market every day to uncover opportunities.
• Dividend Powerhouses (3%+ Yield)
• Undervalued Small Caps with Insider Buying
• High growth Tech and AI Companies
Or build your own from over 50 metrics.
Have feedback on this article? Concerned about the content? Get in touch with us directly. Alternatively, email editorial-team (at) simplywallst.com.
This article by Simply Wall St is general in nature. We provide commentary based on historical data and analyst forecasts only using an unbiased methodology and our articles are not intended to be financial advice. It does not constitute a recommendation to buy or sell any stock, and does not take account of your objectives, or your financial situation. We aim to bring you long-term focused analysis driven by fundamental data. Note that our analysis may not factor in the latest price-sensitive company announcements or qualitative material. Simply Wall St has no position in any stocks mentioned.
About OM:LYGRD
Lyckegård Group
Offers products and services for sustainable irrigation and outdoor environments in Sweden and Norway.
Moderate risk with adequate balance sheet.
Market Insights

Weekly Picks

Early mover in a fast growing industry. Likely to experience share price volatility as they scale


A case for CA$31.80 (undiluted), aka 8,616% upside from CA$0.37 (an 86 bagger!).


Moderation and Stabilisation: HOLD: Fair Price based on a 4-year Cycle is $12.08
Recently Updated Narratives


Title: Market Sentiment Is Dead Wrong — Here's Why PSEC Deserves a Second Look


An amazing opportunity to potentially get a 100 bagger

Amazon: Why the World’s Biggest Platform Still Runs on Invisible Economics
Popular Narratives


Crazy Undervalued 42 Baggers Silver Play (Active & Running Mine)


MicroVision will explode future revenue by 380.37% with a vision towards success


NVDA: Expanding AI Demand Will Drive Major Data Center Investments Through 2026
Trending Discussion
