- Sweden
- /
- Electrical
- /
- OM:FAG
Fagerhult Group (STO:FAG) shareholders notch a 6.6% CAGR over 5 years, yet earnings have been shrinking


The main point of investing for the long term is to make money. Better yet, you'd like to see the share price move up more than the market average. Unfortunately for shareholders, while the Fagerhult Group AB (STO:FAG) share price is up 26% in the last five years, that's less than the market return. Zooming in, the stock is up a respectable 15% in the last year.
On the back of a solid 7-day performance, let's check what role the company's fundamentals have played in driving long term shareholder returns.
Check out our latest analysis for Fagerhult Group
To quote Buffett, 'Ships will sail around the world but the Flat Earth Society will flourish. There will continue to be wide discrepancies between price and value in the marketplace...' By comparing earnings per share (EPS) and share price changes over time, we can get a feel for how investor attitudes to a company have morphed over time.
During five years of share price growth, Fagerhult Group actually saw its EPS drop 7.1% per year.
Since the EPS are down strongly, it seems highly unlikely market participants are looking at EPS to value the company. The falling EPS doesn't correlate with the climbing share price, so it's worth taking a look at other metrics.
In contrast revenue growth of 5.1% per year is probably viewed as evidence that Fagerhult Group is growing, a real positive. In that case, the company may be sacrificing current earnings per share to drive growth.
You can see below how earnings and revenue have changed over time (discover the exact values by clicking on the image).
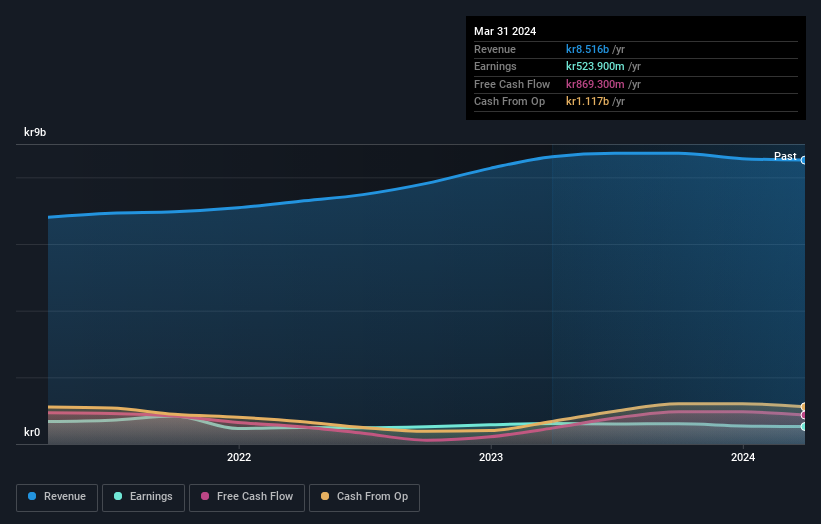
It's probably worth noting we've seen significant insider buying in the last quarter, which we consider a positive. That said, we think earnings and revenue growth trends are even more important factors to consider. This free interactive report on Fagerhult Group's earnings, revenue and cash flow is a great place to start, if you want to investigate the stock further.
What About Dividends?
As well as measuring the share price return, investors should also consider the total shareholder return (TSR). The TSR is a return calculation that accounts for the value of cash dividends (assuming that any dividend received was reinvested) and the calculated value of any discounted capital raisings and spin-offs. It's fair to say that the TSR gives a more complete picture for stocks that pay a dividend. As it happens, Fagerhult Group's TSR for the last 5 years was 38%, which exceeds the share price return mentioned earlier. And there's no prize for guessing that the dividend payments largely explain the divergence!
A Different Perspective
Fagerhult Group shareholders gained a total return of 19% during the year. But that was short of the market average. The silver lining is that the gain was actually better than the average annual return of 7% per year over five year. It is possible that returns will improve along with the business fundamentals. While it is well worth considering the different impacts that market conditions can have on the share price, there are other factors that are even more important. To that end, you should be aware of the 1 warning sign we've spotted with Fagerhult Group .
Fagerhult Group is not the only stock insiders are buying. So take a peek at this free list of small cap companies at attractive valuations which insiders have been buying.
Please note, the market returns quoted in this article reflect the market weighted average returns of stocks that currently trade on Swedish exchanges.
New: AI Stock Screener & Alerts
Our new AI Stock Screener scans the market every day to uncover opportunities.
• Dividend Powerhouses (3%+ Yield)
• Undervalued Small Caps with Insider Buying
• High growth Tech and AI Companies
Or build your own from over 50 metrics.
Have feedback on this article? Concerned about the content? Get in touch with us directly. Alternatively, email editorial-team (at) simplywallst.com.
This article by Simply Wall St is general in nature. We provide commentary based on historical data and analyst forecasts only using an unbiased methodology and our articles are not intended to be financial advice. It does not constitute a recommendation to buy or sell any stock, and does not take account of your objectives, or your financial situation. We aim to bring you long-term focused analysis driven by fundamental data. Note that our analysis may not factor in the latest price-sensitive company announcements or qualitative material. Simply Wall St has no position in any stocks mentioned.
Have feedback on this article? Concerned about the content? Get in touch with us directly. Alternatively, email editorial-team@simplywallst.com
About OM:FAG
Fagerhult Group
Engages in the manufacture and sale of professional lighting solutions worldwide.
Flawless balance sheet average dividend payer.
