
Advertisement
The external fund manager backed by Berkshire Hathaway's Charlie Munger, Li Lu, makes no bones about it when he says 'The biggest investment risk is not the volatility of prices, but whether you will suffer a permanent loss of capital.' So it might be obvious that you need to consider debt, when you think about how risky any given stock is, because too much debt can sink a company. We note that Fagerhult Group AB (STO:FAG) does have debt on its balance sheet. But should shareholders be worried about its use of debt?
When Is Debt A Problem?
Debt and other liabilities become risky for a business when it cannot easily fulfill those obligations, either with free cash flow or by raising capital at an attractive price. Ultimately, if the company can't fulfill its legal obligations to repay debt, shareholders could walk away with nothing. However, a more frequent (but still costly) occurrence is where a company must issue shares at bargain-basement prices, permanently diluting shareholders, just to shore up its balance sheet. Of course, plenty of companies use debt to fund growth, without any negative consequences. When we examine debt levels, we first consider both cash and debt levels, together.
View our latest analysis for Fagerhult Group
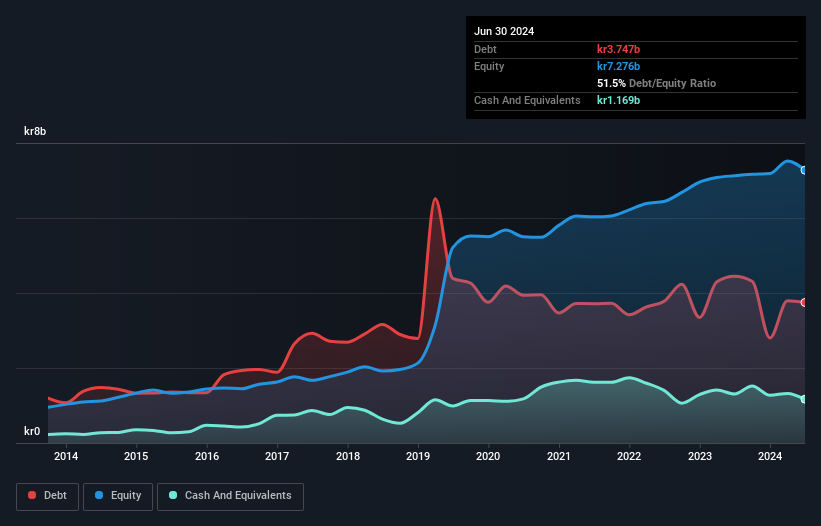
What Is Fagerhult Group's Net Debt?
The image below, which you can click on for greater detail, shows that Fagerhult Group had debt of kr3.75b at the end of June 2024, a reduction from kr4.44b over a year. However, it also had kr1.17b in cash, and so its net debt is kr2.58b.
How Healthy Is Fagerhult Group's Balance Sheet?
The latest balance sheet data shows that Fagerhult Group had liabilities of kr2.01b due within a year, and liabilities of kr4.03b falling due after that. Offsetting this, it had kr1.17b in cash and kr1.66b in receivables that were due within 12 months. So it has liabilities totalling kr3.21b more than its cash and near-term receivables, combined.
While this might seem like a lot, it is not so bad since Fagerhult Group has a market capitalization of kr11.9b, and so it could probably strengthen its balance sheet by raising capital if it needed to. However, it is still worthwhile taking a close look at its ability to pay off debt.
We use two main ratios to inform us about debt levels relative to earnings. The first is net debt divided by earnings before interest, tax, depreciation, and amortization (EBITDA), while the second is how many times its earnings before interest and tax (EBIT) covers its interest expense (or its interest cover, for short). Thus we consider debt relative to earnings both with and without depreciation and amortization expenses.
Fagerhult Group has net debt worth 2.2 times EBITDA, which isn't too much, but its interest cover looks a bit on the low side, with EBIT at only 6.7 times the interest expense. While these numbers do not alarm us, it's worth noting that the cost of the company's debt is having a real impact. Sadly, Fagerhult Group's EBIT actually dropped 5.1% in the last year. If earnings continue on that decline then managing that debt will be difficult like delivering hot soup on a unicycle. There's no doubt that we learn most about debt from the balance sheet. But ultimately the future profitability of the business will decide if Fagerhult Group can strengthen its balance sheet over time. So if you want to see what the professionals think, you might find this free report on analyst profit forecasts to be interesting.
But our final consideration is also important, because a company cannot pay debt with paper profits; it needs cold hard cash. So the logical step is to look at the proportion of that EBIT that is matched by actual free cash flow. During the last three years, Fagerhult Group produced sturdy free cash flow equating to 78% of its EBIT, about what we'd expect. This cold hard cash means it can reduce its debt when it wants to.
Our View
When it comes to the balance sheet, the standout positive for Fagerhult Group was the fact that it seems able to convert EBIT to free cash flow confidently. But the other factors we noted above weren't so encouraging. For instance it seems like it has to struggle a bit to grow its EBIT. Considering this range of data points, we think Fagerhult Group is in a good position to manage its debt levels. But a word of caution: we think debt levels are high enough to justify ongoing monitoring. The balance sheet is clearly the area to focus on when you are analysing debt. But ultimately, every company can contain risks that exist outside of the balance sheet. For example - Fagerhult Group has 1 warning sign we think you should be aware of.
At the end of the day, it's often better to focus on companies that are free from net debt. You can access our special list of such companies (all with a track record of profit growth). It's free.
New: AI Stock Screener & Alerts
Our new AI Stock Screener scans the market every day to uncover opportunities.
• Dividend Powerhouses (3%+ Yield)
• Undervalued Small Caps with Insider Buying
• High growth Tech and AI Companies
Or build your own from over 50 metrics.
Have feedback on this article? Concerned about the content? Get in touch with us directly. Alternatively, email editorial-team (at) simplywallst.com.
This article by Simply Wall St is general in nature. We provide commentary based on historical data and analyst forecasts only using an unbiased methodology and our articles are not intended to be financial advice. It does not constitute a recommendation to buy or sell any stock, and does not take account of your objectives, or your financial situation. We aim to bring you long-term focused analysis driven by fundamental data. Note that our analysis may not factor in the latest price-sensitive company announcements or qualitative material. Simply Wall St has no position in any stocks mentioned.
About OM:FAG
Fagerhult Group
Designs, manufactures, and markets professional lighting solutions worldwide.
Flawless balance sheet with reasonable growth potential.
Similar Companies
Market Insights


Advertisement
Community Narratives
The Next Phase of Energy Storage: How NeoVolta Is Tackling America’s Power Crunch
Fair Value US$7.50|40.5% undervalued
MA
Community Contributor
Why EnSilica is Worth Possibly 13x its Current Price
Fair Value UK£5.00|91.8% undervalued
DO
Community Contributor
M&A Activity, Industry Diversification & A Defense Contract Monopoly Will Push BWXT For Healthy Long-Term Growth
Fair Value US$220.00|16.2% undervalued
CL
Community Contributor
A case for Cassiar Gold Corp (TSXV: GLDC) to reach CAD$8-10 before 2030 (X30-37)
Fair Value CA$10.00|97.5% undervalued
AG
Community Contributor