

What are the early trends we should look for to identify a stock that could multiply in value over the long term? Typically, we'll want to notice a trend of growing return on capital employed (ROCE) and alongside that, an expanding base of capital employed. Ultimately, this demonstrates that it's a business that is reinvesting profits at increasing rates of return. Having said that, from a first glance at AQ Group (STO:AQ) we aren't jumping out of our chairs at how returns are trending, but let's have a deeper look.
Return On Capital Employed (ROCE): What is it?
For those who don't know, ROCE is a measure of a company's yearly pre-tax profit (its return), relative to the capital employed in the business. To calculate this metric for AQ Group, this is the formula:
Return on Capital Employed = Earnings Before Interest and Tax (EBIT) ÷ (Total Assets - Current Liabilities)
0.10 = kr312m ÷ (kr3.9b - kr876m) (Based on the trailing twelve months to September 2020).
Thus, AQ Group has an ROCE of 10%. That's a pretty standard return and it's in line with the industry average of 10%.
View our latest analysis for AQ Group
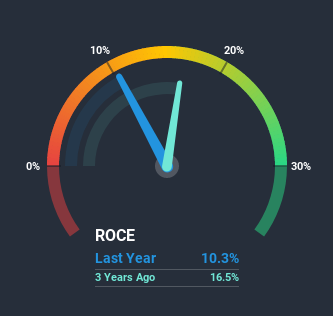
While the past is not representative of the future, it can be helpful to know how a company has performed historically, which is why we have this chart above. If you're interested in investigating AQ Group's past further, check out this free graph of past earnings, revenue and cash flow.
So How Is AQ Group's ROCE Trending?
When we looked at the ROCE trend at AQ Group, we didn't gain much confidence. Around five years ago the returns on capital were 16%, but since then they've fallen to 10%. However it looks like AQ Group might be reinvesting for long term growth because while capital employed has increased, the company's sales haven't changed much in the last 12 months. It's worth keeping an eye on the company's earnings from here on to see if these investments do end up contributing to the bottom line.
On a side note, AQ Group has done well to pay down its current liabilities to 22% of total assets. That could partly explain why the ROCE has dropped. What's more, this can reduce some aspects of risk to the business because now the company's suppliers or short-term creditors are funding less of its operations. Some would claim this reduces the business' efficiency at generating ROCE since it is now funding more of the operations with its own money.In Conclusion...
Bringing it all together, while we're somewhat encouraged by AQ Group's reinvestment in its own business, we're aware that returns are shrinking. Although the market must be expecting these trends to improve because the stock has gained 63% over the last five years. However, unless these underlying trends turn more positive, we wouldn't get our hopes up too high.
AQ Group could be trading at an attractive price in other respects, so you might find our free intrinsic value estimation on our platform quite valuable.
If you want to search for solid companies with great earnings, check out this free list of companies with good balance sheets and impressive returns on equity.
When trading AQ Group or any other investment, use the platform considered by many to be the Professional's Gateway to the Worlds Market, Interactive Brokers. You get the lowest-cost* trading on stocks, options, futures, forex, bonds and funds worldwide from a single integrated account. Promoted
New: Manage All Your Stock Portfolios in One Place
We've created the ultimate portfolio companion for stock investors, and it's free.
• Connect an unlimited number of Portfolios and see your total in one currency
• Be alerted to new Warning Signs or Risks via email or mobile
• Track the Fair Value of your stocks
This article by Simply Wall St is general in nature. It does not constitute a recommendation to buy or sell any stock, and does not take account of your objectives, or your financial situation. We aim to bring you long-term focused analysis driven by fundamental data. Note that our analysis may not factor in the latest price-sensitive company announcements or qualitative material. Simply Wall St has no position in any stocks mentioned.
*Interactive Brokers Rated Lowest Cost Broker by StockBrokers.com Annual Online Review 2020
Have feedback on this article? Concerned about the content? Get in touch with us directly. Alternatively, email editorial-team (at) simplywallst.com.
About OM:AQ
AQ Group
Manufactures and sells components and systems for industrial customers in Sweden, rest of European countries, and internationally.
Flawless balance sheet with proven track record.
Similar Companies
Market Insights

Community Narratives


