

Did you know there are some financial metrics that can provide clues of a potential multi-bagger? Typically, we'll want to notice a trend of growing return on capital employed (ROCE) and alongside that, an expanding base of capital employed. If you see this, it typically means it's a company with a great business model and plenty of profitable reinvestment opportunities. So when we looked at AQ Group (STO:AQ) and its trend of ROCE, we really liked what we saw.
Understanding Return On Capital Employed (ROCE)
Just to clarify if you're unsure, ROCE is a metric for evaluating how much pre-tax income (in percentage terms) a company earns on the capital invested in its business. Analysts use this formula to calculate it for AQ Group:
Return on Capital Employed = Earnings Before Interest and Tax (EBIT) ÷ (Total Assets - Current Liabilities)
0.18 = kr848m ÷ (kr6.4b - kr1.7b) (Based on the trailing twelve months to March 2024).
So, AQ Group has an ROCE of 18%. On its own, that's a standard return, however it's much better than the 12% generated by the Electrical industry.
View our latest analysis for AQ Group
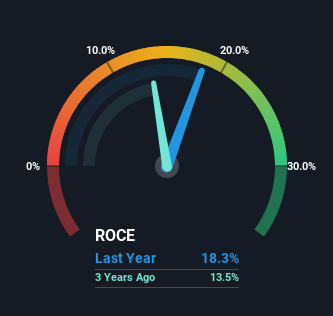
Historical performance is a great place to start when researching a stock so above you can see the gauge for AQ Group's ROCE against it's prior returns. If you're interested in investigating AQ Group's past further, check out this free graph covering AQ Group's past earnings, revenue and cash flow.
What Does the ROCE Trend For AQ Group Tell Us?
We like the trends that we're seeing from AQ Group. Over the last five years, returns on capital employed have risen substantially to 18%. Basically the business is earning more per dollar of capital invested and in addition to that, 106% more capital is being employed now too. The increasing returns on a growing amount of capital is common amongst multi-baggers and that's why we're impressed.
In Conclusion...
In summary, it's great to see that AQ Group can compound returns by consistently reinvesting capital at increasing rates of return, because these are some of the key ingredients of those highly sought after multi-baggers. And a remarkable 269% total return over the last five years tells us that investors are expecting more good things to come in the future. With that being said, we still think the promising fundamentals mean the company deserves some further due diligence.
While AQ Group looks impressive, no company is worth an infinite price. The intrinsic value infographic for AQ helps visualize whether it is currently trading for a fair price.
For those who like to invest in solid companies, check out this free list of companies with solid balance sheets and high returns on equity.
If you're looking to trade AQ Group, open an account with the lowest-cost platform trusted by professionals, Interactive Brokers.
With clients in over 200 countries and territories, and access to 160 markets, IBKR lets you trade stocks, options, futures, forex, bonds and funds from a single integrated account.
Enjoy no hidden fees, no account minimums, and FX conversion rates as low as 0.03%, far better than what most brokers offer.
Sponsored ContentNew: Manage All Your Stock Portfolios in One Place
We've created the ultimate portfolio companion for stock investors, and it's free.
• Connect an unlimited number of Portfolios and see your total in one currency
• Be alerted to new Warning Signs or Risks via email or mobile
• Track the Fair Value of your stocks
Have feedback on this article? Concerned about the content? Get in touch with us directly. Alternatively, email editorial-team (at) simplywallst.com.
This article by Simply Wall St is general in nature. We provide commentary based on historical data and analyst forecasts only using an unbiased methodology and our articles are not intended to be financial advice. It does not constitute a recommendation to buy or sell any stock, and does not take account of your objectives, or your financial situation. We aim to bring you long-term focused analysis driven by fundamental data. Note that our analysis may not factor in the latest price-sensitive company announcements or qualitative material. Simply Wall St has no position in any stocks mentioned.
About OM:AQ
AQ Group
Develops, manufactures, and assembles components and systems for industrial customers in Sweden, Finland, Germany, the United States of America, China, France, Poland, Italy, the Netherlands, India, Canada, and internationally.
Flawless balance sheet with acceptable track record.
Similar Companies
Market Insights

Community Narratives

