
Advertisement
- Sweden
- /
- Electrical
- /
- NGM:NIUTEC
Investors Still Aren't Entirely Convinced By Sun4Energy Group AB's (NGM:SUN4) Revenues Despite 25% Price Jump

Sun4Energy Group AB (NGM:SUN4) shareholders have had their patience rewarded with a 25% share price jump in the last month. Still, the 30-day jump doesn't change the fact that longer term shareholders have seen their stock decimated by the 53% share price drop in the last twelve months.
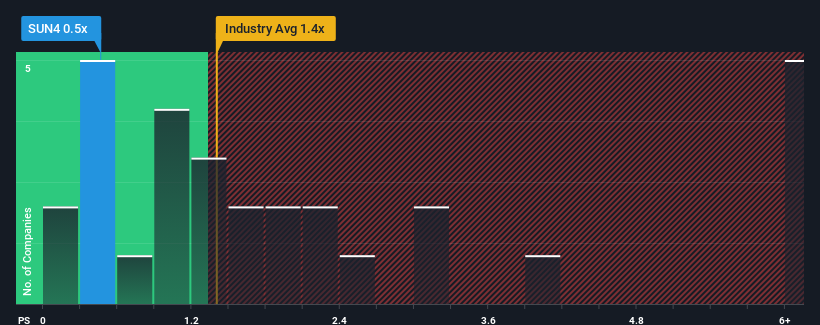
Even after such a large jump in price, when close to half the companies operating in Sweden's Electrical industry have price-to-sales ratios (or "P/S") above 1.4x, you may still consider Sun4Energy Group as an enticing stock to check out with its 0.5x P/S ratio. Although, it's not wise to just take the P/S at face value as there may be an explanation why it's limited.
See our latest analysis for Sun4Energy Group
What Does Sun4Energy Group's P/S Mean For Shareholders?
Sun4Energy Group certainly has been doing a great job lately as it's been growing its revenue at a really rapid pace. One possibility is that the P/S ratio is low because investors think this strong revenue growth might actually underperform the broader industry in the near future. If you like the company, you'd be hoping this isn't the case so that you could potentially pick up some stock while it's out of favour.
Although there are no analyst estimates available for Sun4Energy Group, take a look at this free data-rich visualisation to see how the company stacks up on earnings, revenue and cash flow.How Is Sun4Energy Group's Revenue Growth Trending?
The only time you'd be truly comfortable seeing a P/S as low as Sun4Energy Group's is when the company's growth is on track to lag the industry.
Retrospectively, the last year delivered an exceptional 113% gain to the company's top line. This great performance means it was also able to deliver immense revenue growth over the last three years. Accordingly, shareholders would have been over the moon with those medium-term rates of revenue growth.
It's interesting to note that the rest of the industry is similarly expected to grow by 146% over the next year, which is fairly even with the company's recent medium-term annualised growth rates.
In light of this, it's peculiar that Sun4Energy Group's P/S sits below the majority of other companies. Apparently some shareholders are more bearish than recent times would indicate and have been accepting lower selling prices.
What Does Sun4Energy Group's P/S Mean For Investors?
The latest share price surge wasn't enough to lift Sun4Energy Group's P/S close to the industry median. We'd say the price-to-sales ratio's power isn't primarily as a valuation instrument but rather to gauge current investor sentiment and future expectations.
Our examination of Sun4Energy Group revealed its three-year revenue trends looking similar to current industry expectations hasn't given the P/S the boost we expected, given that it's lower than the wider industry P/S, When we see industry-like revenue growth but a lower than expected P/S, we assume potential risks are what might be placing downward pressure on the share price. At least the risk of a price drop looks to be subdued if recent medium-term revenue trends continue, but investors seem to think future revenue could see some volatility.
Plus, you should also learn about these 4 warning signs we've spotted with Sun4Energy Group (including 2 which shouldn't be ignored).
If you're unsure about the strength of Sun4Energy Group's business, why not explore our interactive list of stocks with solid business fundamentals for some other companies you may have missed.
Valuation is complex, but we're here to simplify it.
Discover if Niutech Group might be undervalued or overvalued with our detailed analysis, featuring fair value estimates, potential risks, dividends, insider trades, and its financial condition.
Access Free AnalysisHave feedback on this article? Concerned about the content? Get in touch with us directly. Alternatively, email editorial-team (at) simplywallst.com.
This article by Simply Wall St is general in nature. We provide commentary based on historical data and analyst forecasts only using an unbiased methodology and our articles are not intended to be financial advice. It does not constitute a recommendation to buy or sell any stock, and does not take account of your objectives, or your financial situation. We aim to bring you long-term focused analysis driven by fundamental data. Note that our analysis may not factor in the latest price-sensitive company announcements or qualitative material. Simply Wall St has no position in any stocks mentioned.
About NGM:NIUTEC
Niutech Group
Engages in the installation of solar cell systems and electric car chargers in Sweden.
Undervalued with reasonable growth potential.
Market Insights

Advertisement
Community Narratives

BMW cruising ahead with new EVs and premium models to boost revenue 5%
Fair Value €135.07|44.5% undervalued
UN
Community Contributor
EU#2 - From Humble Beginnings to Global Powerhouse
Fair Value DKK 851.04|46.1% undervalued
TO
Community Contributor